Have you ever wished for a tool that helps you pinpoint market movements more accurately? Enter the ...
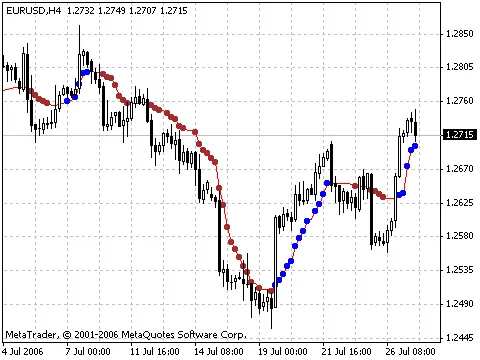
Hey there, fellow traders! Today, we’re diving into the world of the AMA & AMAsig Indicator. Whether...
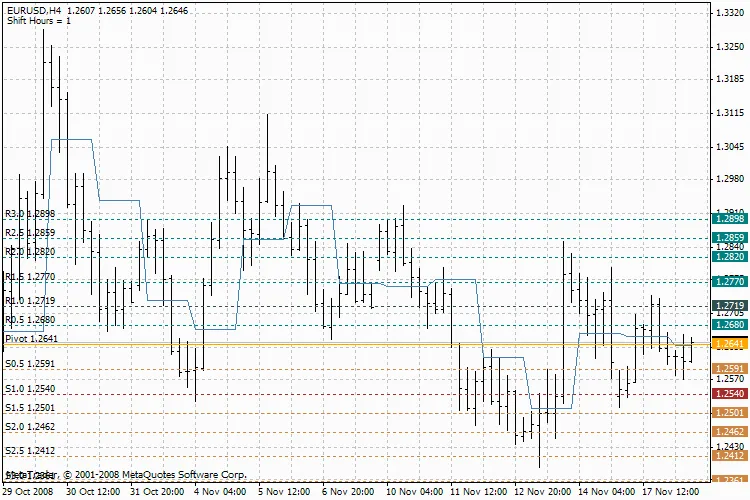
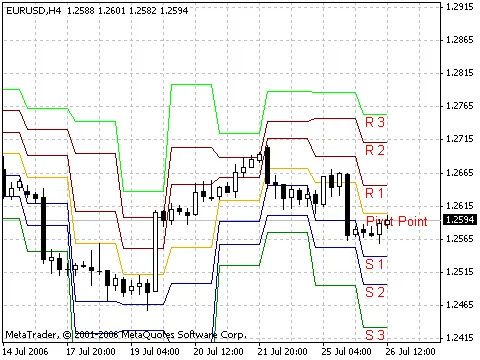
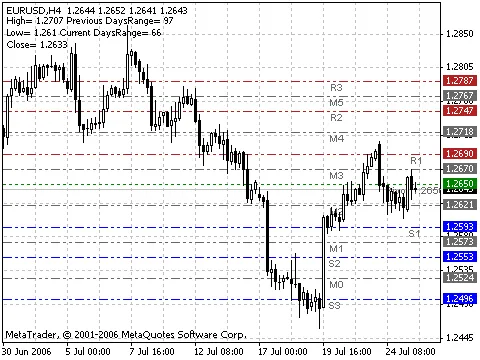
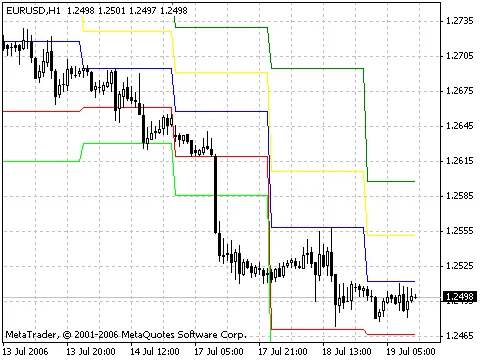
If you're looking to elevate your trading game, the Pivot AllLevels Indicator might just be the tool...
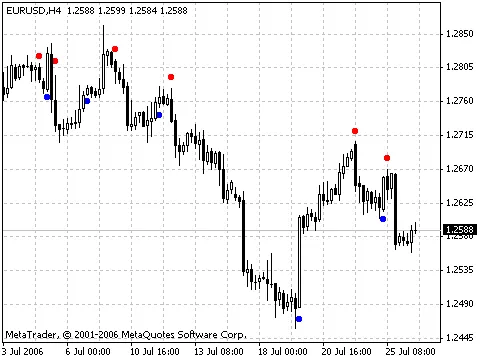
Welcome, traders! Today, we’re diving into the world of the BrainTrend1Sig Indicator. This powerful ...
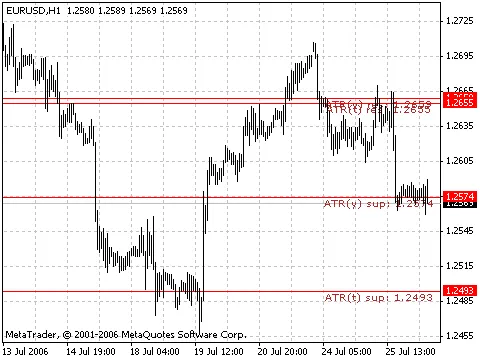
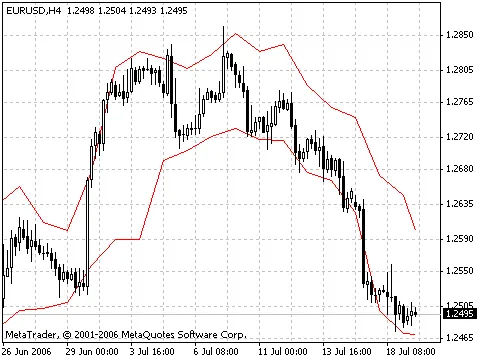
Understanding ATR Levels Indicator The Average True Range (ATR) Levels Indicator is a powerful tool ...
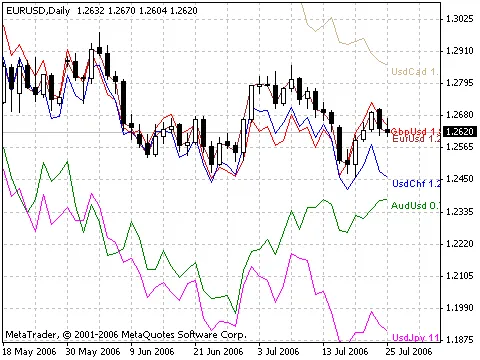
What is the All USD Pair Indicator?The All USD Pair Indicator is an essential tool for forex traders...
Hey there, fellow traders! Today, we're diving into a tool that can give your trading strategy a ser...
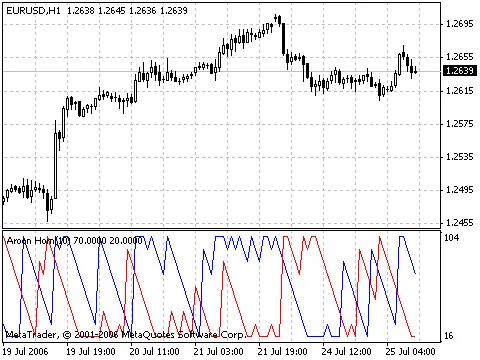
The Aroon Horn Indicator is an essential tool for traders looking to gain a competitive edge in the ...
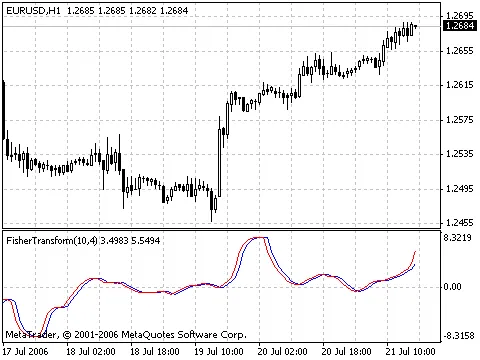
If you're looking to enhance your trading game, let me introduce you to the Fisher_org_v1 Indicator....
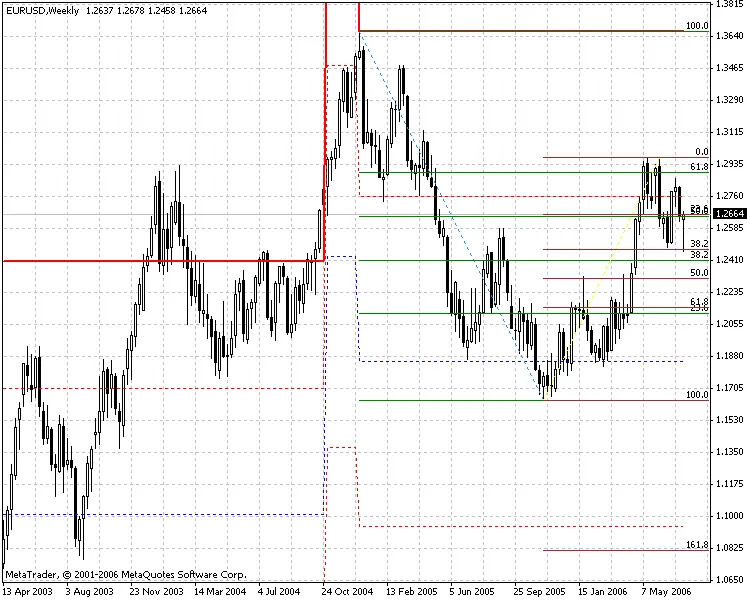
If you’ve been trading for a while, you’ve probably heard of the Fibonacci Retracement tool. It's a ...
Welcome to the world of trading! Today, we're diving into one of the most useful tools in our arsena...
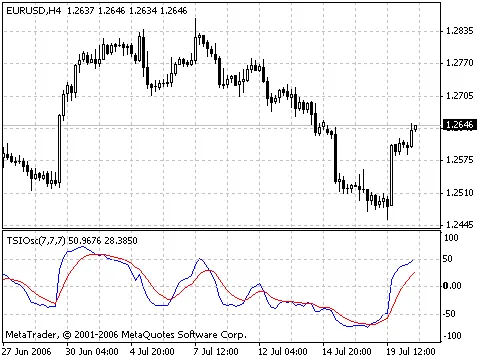
The TSI Oscillator, or True Strength Index, is a powerful tool that many traders swear by. Whether y...
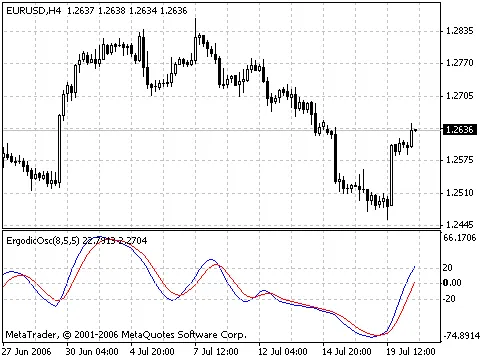
The Ergodic Oscillator is an essential tool for traders looking to refine their strategies and bette...
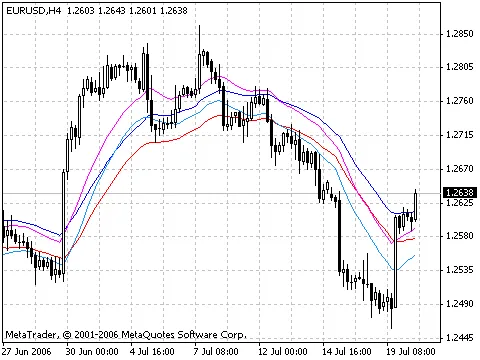
Understanding the EMA Trend Indicator The Exponential Moving Average (EMA) Trend Indicator is a go-t...
What is the DFC Next Indicator? The DFC Next Indicator is a powerful tool that can help enhance your...
What is the DeMarker Pivots Indicator? The DeMarker Pivots Indicator is a powerful tool that helps t...
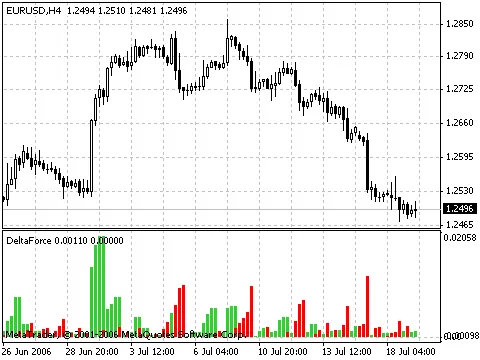
Hey there, fellow traders! Today, we're diving into the world of the Delta Force Indicator. If you'r...
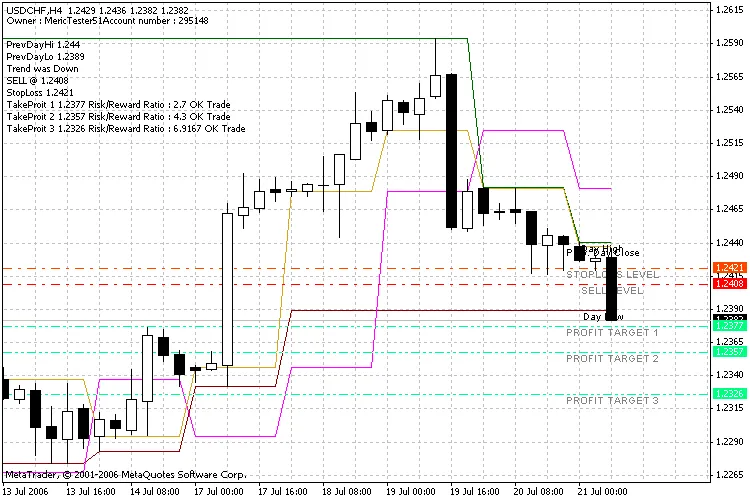
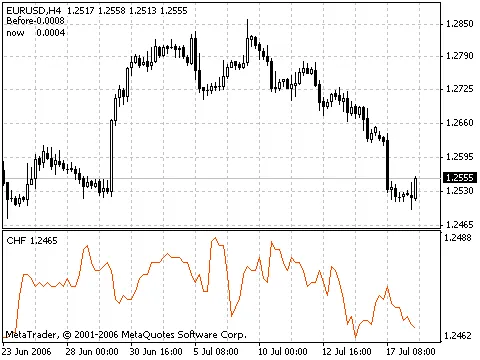
Correlation Between USDCHF and EURUSD If you're trading forex, understanding the correlation between...
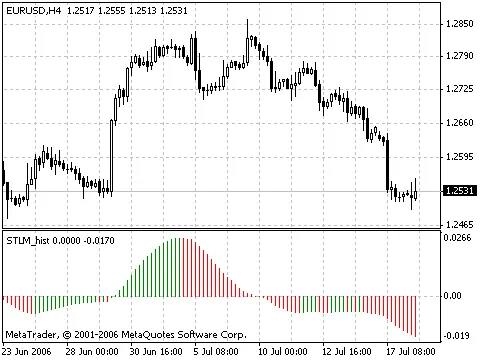
Hey fellow traders! Today, let’s dive into the world of the STLM Histogram Indicator. This tool can ...
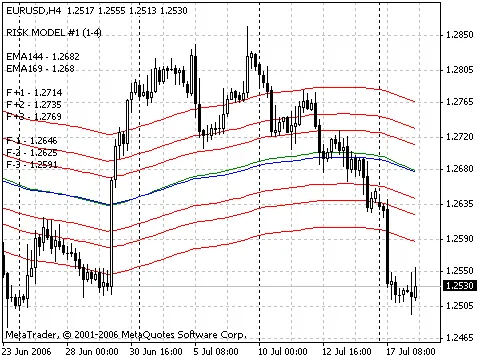
Understanding the Vegas Indicator The Vegas Indicator is a powerful tool designed to help traders ma...