Technical Indicator

Understanding the Accumulation/Distribution Indicator in Trading
MetaTrader4
Understanding the Accumulation/Distribution Indicator in Trading

The Accumulation/Distribution (A/D) Indicator is a crucial tool for traders, focusing on price changes and trading volume. Essentially, this indicator weighs price changes against trading volume—higher volumes mean that price shifts hold more significance in determining the indicator's value. Accumulation/Distribution, A/D Think of the A/D Indicator as a sibling to the more widely recognized On Balance Volume (OBV) indicator. Both serve to validate price movements by analyzing trading volumes. When you see the A/D indicator on the rise, it signals accumulation or buying interest in a security, suggesting that most of the trading volume is linked to increasing prices. Conversely, a declining A/D indicates distribution or selling pressure, where the bulk of the trading happens during falling prices. Keep an eye on divergences between the A/D and the price of a security. These discrepancies often foreshadow potential price shifts. For instance, if the A/D is climbing while the price is dropping, it’s a hint that a price reversal might be on the horizon. How to Calculate the A/D Indicator The calculation involves adding or subtracting a portion of the daily volume to/from the current accumulated value of the A/D indicator. If the closing price is closer to the day’s high, more volume is added. If it’s closer to the day’s low, more is subtracted. If it’s smack dab in the middle, the indicator remains unchanged.     A/D(i) = ((CLOSE(i) - LOW(i)) - (HIGH(i) - CLOSE(i)) * VOLUME(i) / (HIGH(i) - LOW(i)) + A/D(i-1) Where:A/D(i) — the value of the A/D indicator for the current bar;CLOSE(i) — the closing price of the bar;LOW(i) — the lowest price of the bar;HIGH(i) — the highest price of the bar;VOLUME(i) — the volume of trades;A/D(i-1) — the A/D indicator value for the previous bar. Further Reading If you want to dive deeper into the A/D indicator, check out the full description in the Technical analysis: Accumulation/Distribution section.

2005.11.29
Mastering the Accelerator Oscillator for Trading Success
MetaTrader4
Mastering the Accelerator Oscillator for Trading Success

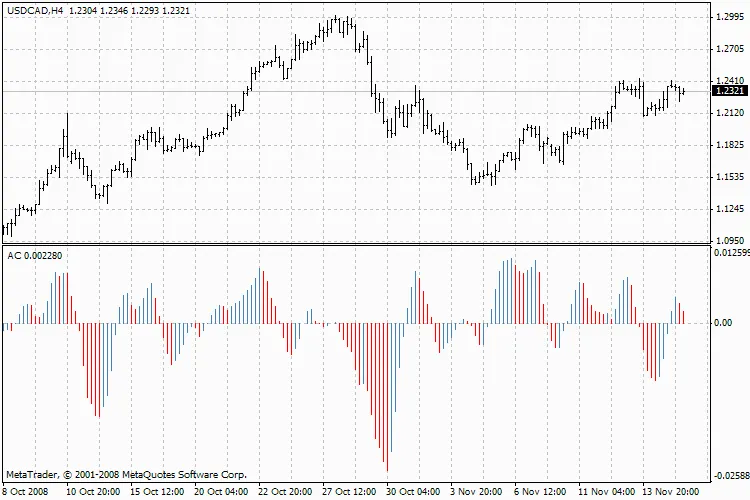
The Accelerator/Decelerator Indicator (AC) is a powerful tool that helps traders gauge the acceleration and deceleration of market momentum. Think of it as your early warning system; it can signal changes in market direction before the price shifts, giving you a significant edge. The zero line, or nought line, is where the driving force and acceleration are in balance. When the AC indicator is above zero, it typically indicates a higher likelihood of continued upward movement; conversely, if it's below zero, the same holds true for downward movement. Unlike the Awesome Oscillator, simply crossing the zero line isn't a signal in itself. Instead, pay attention to color changes. Remember, if the AC is red, it's not a good time to buy, and if it's green, you should avoid selling. If you're looking to enter the market in line with the current momentum (the indicator being above zero for buys or below for sells), you want to see two consecutive green bars before buying, or two red bars before selling. If the AC is working against your intended position (below zero for buys or above for sells), you’ll need an extra column for confirmation. In this case, seek three consecutive red columns above the nought line for short positions and three green columns below it for long positions. Calculation The AC bar chart is calculated by taking the difference between the values of the 5-period and 34-period driving force bar charts and then subtracting the 5-period simple moving average (SMA) from that. AC = AO - SMA(AO, 5) Where: SMA — Simple Moving Average; AO — Awesome Oscillator. Understanding the Indicator For a complete breakdown of the Accelerator/Decelerator Oscillator, check out the Technical analysis: Accelerator/Decelerator Oscillator.

2005.11.29
First Previous 396 397 398 399 400 401