Updated: September 15, 2010 - Version 2
Hey traders! If you're like me, you probably appreciate a clean and organized chart. That’s where GRID10 comes into play. This handy indicator draws a grid on your charts using grid lines that are spaced out conveniently at powers of ten. Here’s what’s new in the latest version:
- Optional Intermediate Grid Lines: You can now add intermediate grid lines at 10%, 20%, 25%, or 50% of the major grid lines. This feature can really help with fine-tuning your analysis!
- Dynamic Resizing: The grid resolution is now linked to the range of your chart rather than just the data range. So, if you resize your chart, the grid will adjust automatically at the next tick. To resize, just right-click the margin on the right side of the chart and drag up or down.
- Bug Fix: A correction has been made for odd results caused by the MathMod API function. Check the code for the specifics if you’re interested!
")
How to Get Started with GRID10
Ready to enhance your charting? Here’s how to do it:
- Select the symbol you want to analyze and open it in a chart window.
- Press Ctrl + G to remove the default grid. Alternatively, right-click on the chart, select properties, go to common, and uncheck show grid.
- Download and compile the Grid10.mq4 code, then load the GRID10 Custom Indicator onto your chart.
- The grid will automatically scale according to the chart range you've set.
- If you want intermediate grid lines, choose their frequency from the options available.
Intermediate Line Options
| Intermediate Line Percentage (%) | Number of Sub-divisions between grid lines |
|---|---|
| 0 | - |
| 10 | 10 |
| 20 | 5 |
| 25 | 4 |
| 50 | 2 |
Feel free to customize your grid’s color scheme and line styles as per your preference. And don’t forget, you can always resize the chart by right-clicking in the margin and dragging your mouse!

And that’s all there is to it!
Give GRID10 a try and see how it transforms your trading experience. Happy trading, folks!
Regards, MOOSE
Originally Posted: September 10, 2009 - Version 1
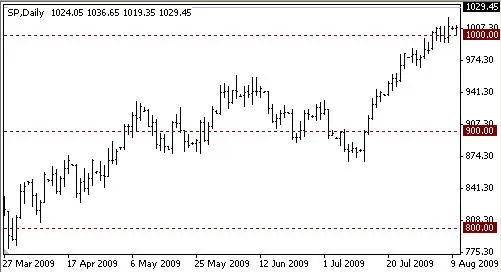
I’ve always found the horizontal grid lines on MT4 charts a bit random and sometimes confusing. That’s why I created GRID10, which places horizontal grid lines on your charts based on a convenient power of ten according to the range of the symbol.
For instance, take the S&P 500, which ranges from below 800 to over 1000. Wouldn’t it be great to have grid lines at 800, 900, and 1000? It makes interpreting data much easier.
Or consider the AUDCAD currency pair, where the chart range is less than 0.1. In this case, grid lines will appear at intervals of 0.01.
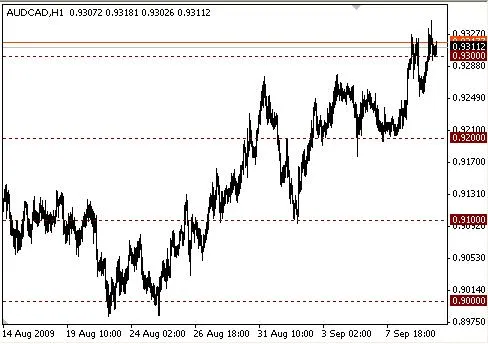
The best part? The grid lines will readjust automatically if you resize the chart, whether you’re changing the number of bars displayed or the range of the symbol.
I hope you find GRID10 useful in your trading journey!


Comments 0