Author: fxcoder
Have you ever felt like you could use a fresh perspective when analyzing your trades? Enter StdScore v4.2, an oscillator that brilliantly mirrors the chart of your selected asset in a separate window. Whether you're a fan of lines, bars, or candles, this tool has you covered. Think of it as a Bollinger Bands indicator, but with a twist—it's displayed in a separate window for a unique view.
In my experience, this indicator is a gem for beginners, offering a new angle on technical signals. I’ve found it particularly handy when using it to filter out those tricky moments that could derail your trades.
How It Works:
This oscillator calculates a standard assessment and presents it in the form of candles. Here’s a quick look at the formula:

Where:
- μ: Moving average
- σ: Standard deviation
Key Features:
- The last candle (current candle) can often redraw itself, especially at the beginning—this is just a quirk of the calculation.
- It doesn't check the availability of history, which can be crucial when using a symbol other than the current one.
Parameter Breakdown:
| Parameter | Description |
|---|---|
| Period | Calculation period |
| Symbol | Symbol; leave empty for the current symbol |
| Reverse | Reverses indicator values |
| Applied Price | Estimated price; by default, uses Median Price (HL / 2) for less redrawing |
| Value and Line Price | Chart type: Line, Bar (High/Low price), Candlestick |
| Bull Color | Color of the bullish candle/bar |
| Bear Color | Color of the bearish candle/bar |
| Background Color | Background color |
| Body Width | Thickness of the candle body; 0 - auto-detect, 1 - body hidden |
| Maximum Bars | Maximum bars displayed; 0 means no limit |
| Shift | Shift of the indicator values |
Interpretation Tips:
- If you're holding a trade in the positive zone, a shift in indicator values from 2 to 4 might signal a local rebound. This is a good time to consider locking in profits if your trade strategy is geared towards short movements.
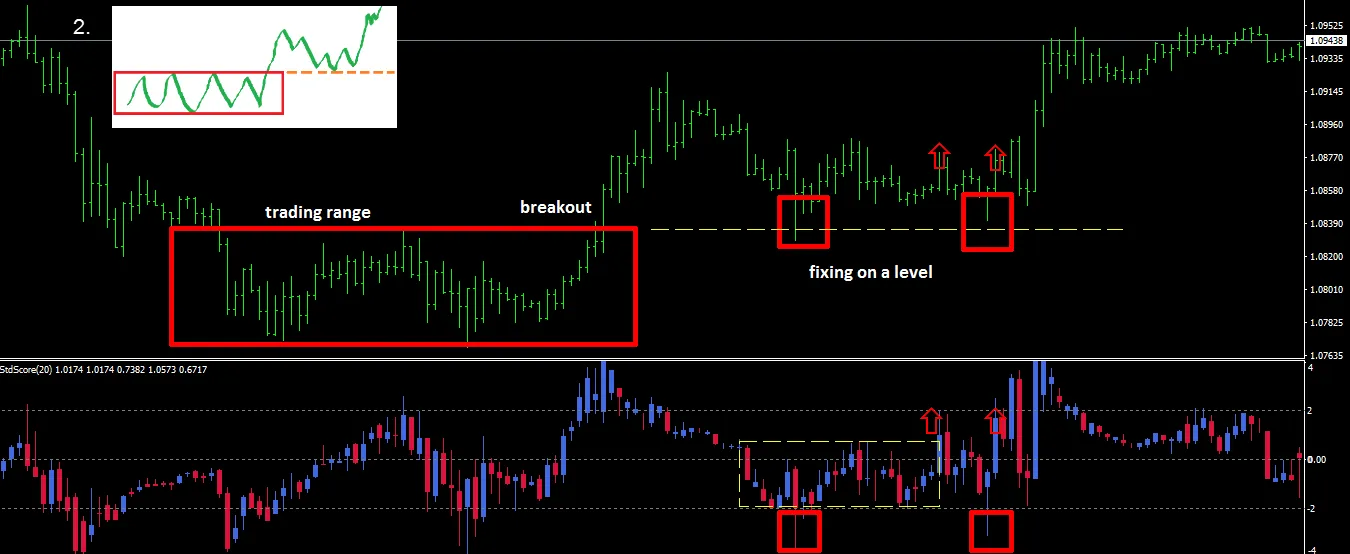
- Use it as a confirmation signal for breakout trading ranges, providing you with early signals for potential transactions.

Have you discovered any interesting ways to leverage this indicator in your trading? I’d love to hear your insights!


Comments 0