If you're looking to elevate your trading game, the Symbol Movement indicator for MetaTrader 4 is a must-have tool. This custom indicator provides insights into the daily candle range of 28 currency pairs, along with their high-low range and whether they're leaning bullish or bearish, all based on real-time market ticks. It’s a quick way to gauge the overall market sentiment without wasting time.
What’s great is that you can easily adjust the default timeframe from Daily to any period you prefer, and you can set the candle (or bar) number from 0 to any previous number. Plus, accessing the desired symbol is as simple as clicking the symbol button.
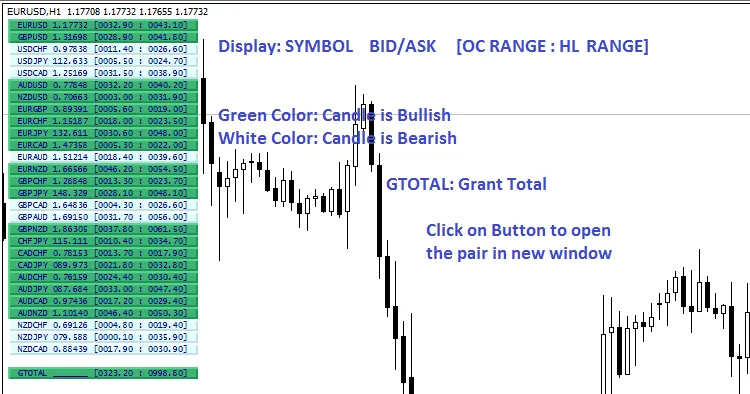
To get a better idea of how this indicator works, check out the image below:
Input Parameters
- Candle Number - For real-time updates, set this to 0. This way, the indicator will refresh every time there’s a new data point. If you’re looking for information on previous candles, feel free to use any number greater than 0.
- Timeframe - You can select the timeframe here. While your chart can display any timeframe, this indicator will provide data according to the timeframe you set in the panel box. The default is Daily, but you're free to change that to suit your needs.
- Button Bullish Color - Customize the bullish color for the button in the panel to make it visually appealing.
- Button Bearish Color - Similarly, set the bearish color for the button to help differentiate market conditions at a glance.
- Button Text Color - Choose the text color for the buttons in the panel box for better readability.
- Show Market Price - Decide whether you want to display the bid or ask price. If you select 'None,' the market price won’t show, and the panel width will adjust accordingly.
- Button Height - Adjust the height of the buttons in the panel to your preference.
- Button Font Size - Set the font size for the button text to ensure it’s legible and fits well in the panel.


Comments 0