Theory:
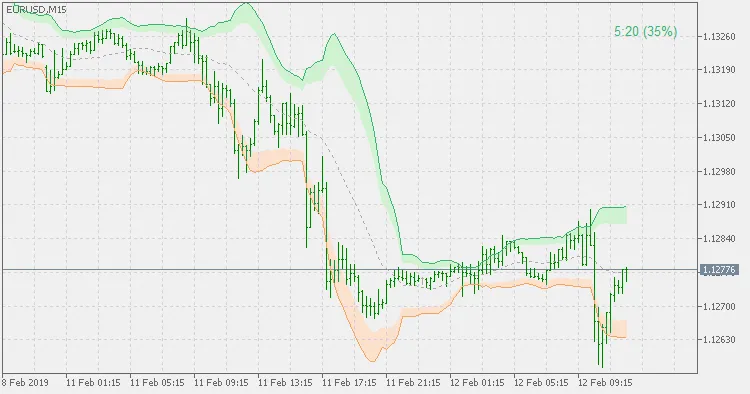
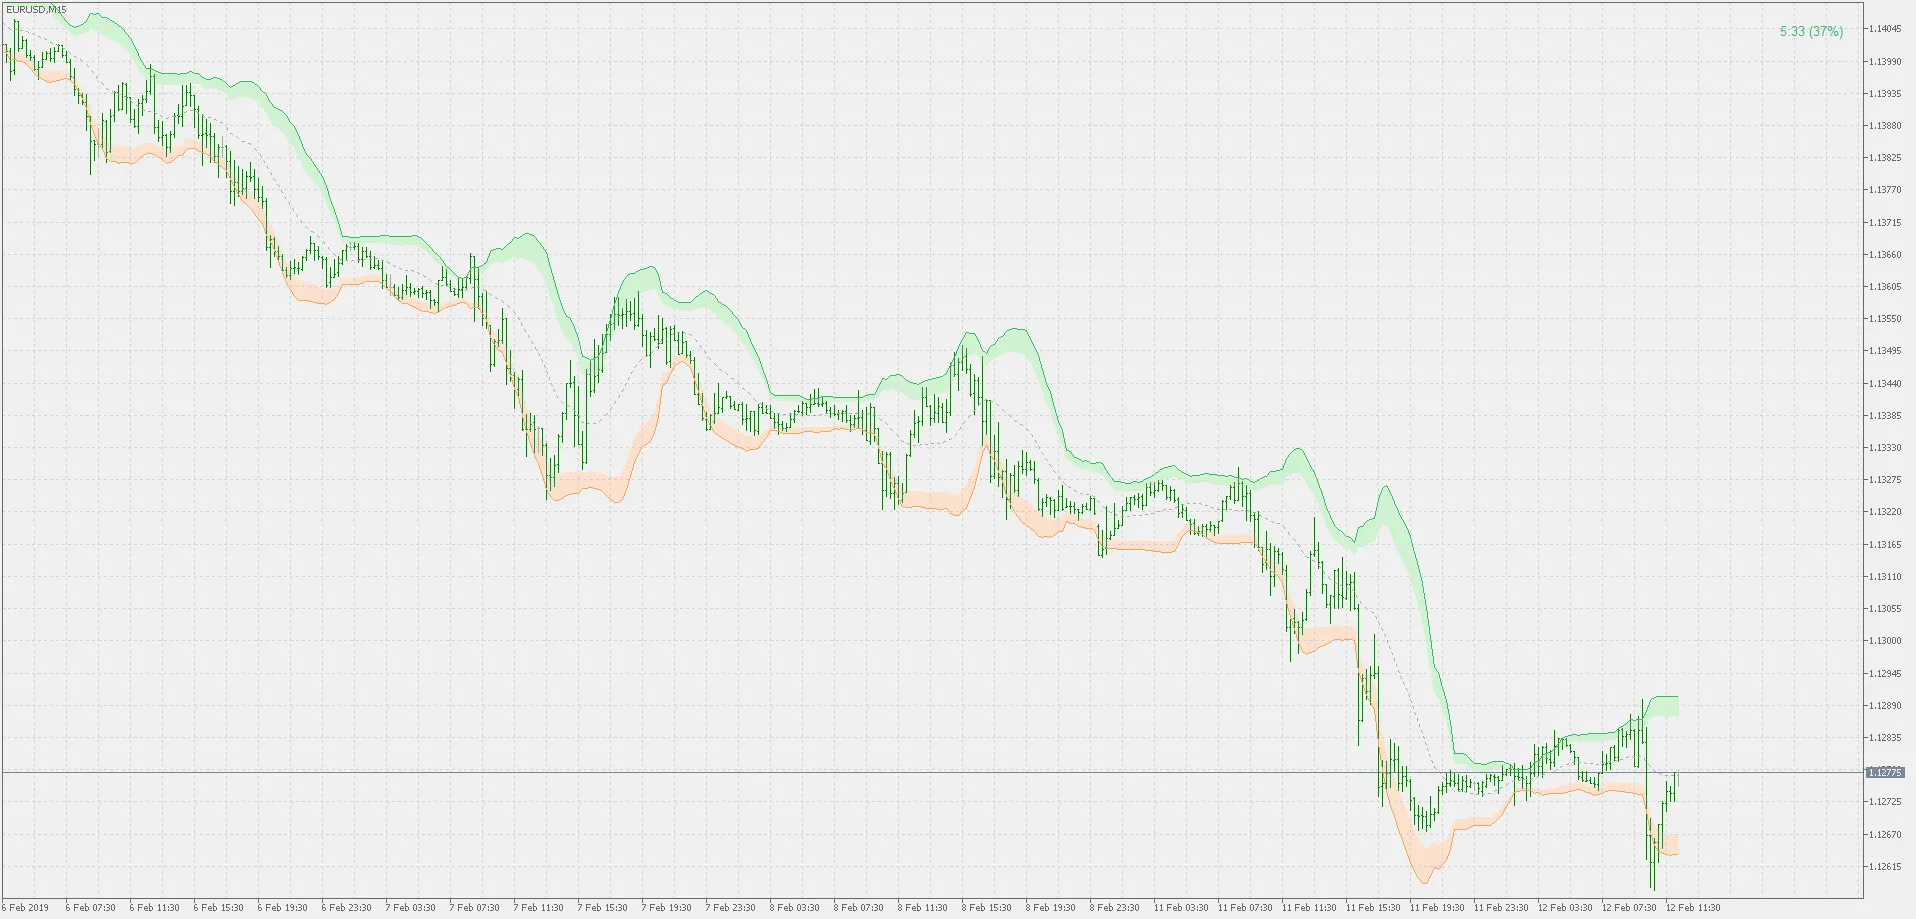
Bollinger Bands are a powerful tool for traders, calculated based on the price action of a security. Simply put, a Bollinger Band® consists of a set of lines that are plotted two standard deviations away from a simple moving average (SMA) of the asset's price. Developed by the renowned trader John Bollinger, this indicator helps identify potential market volatility and price trends.
The unique aspect of Bollinger Bands is their use of standard deviations. Traditionally, they utilize standard deviation, but this version offers the flexibility to choose the standard deviation of a sample as well. Additionally, it introduces Bollinger Bands zones, serving as an early warning system for when prices are entering a "breakout zone."
Usage:
Traders can utilize Bollinger Bands just like any other standard indicator. They offer insights into market conditions, helping you make informed trading decisions.


Comments 0