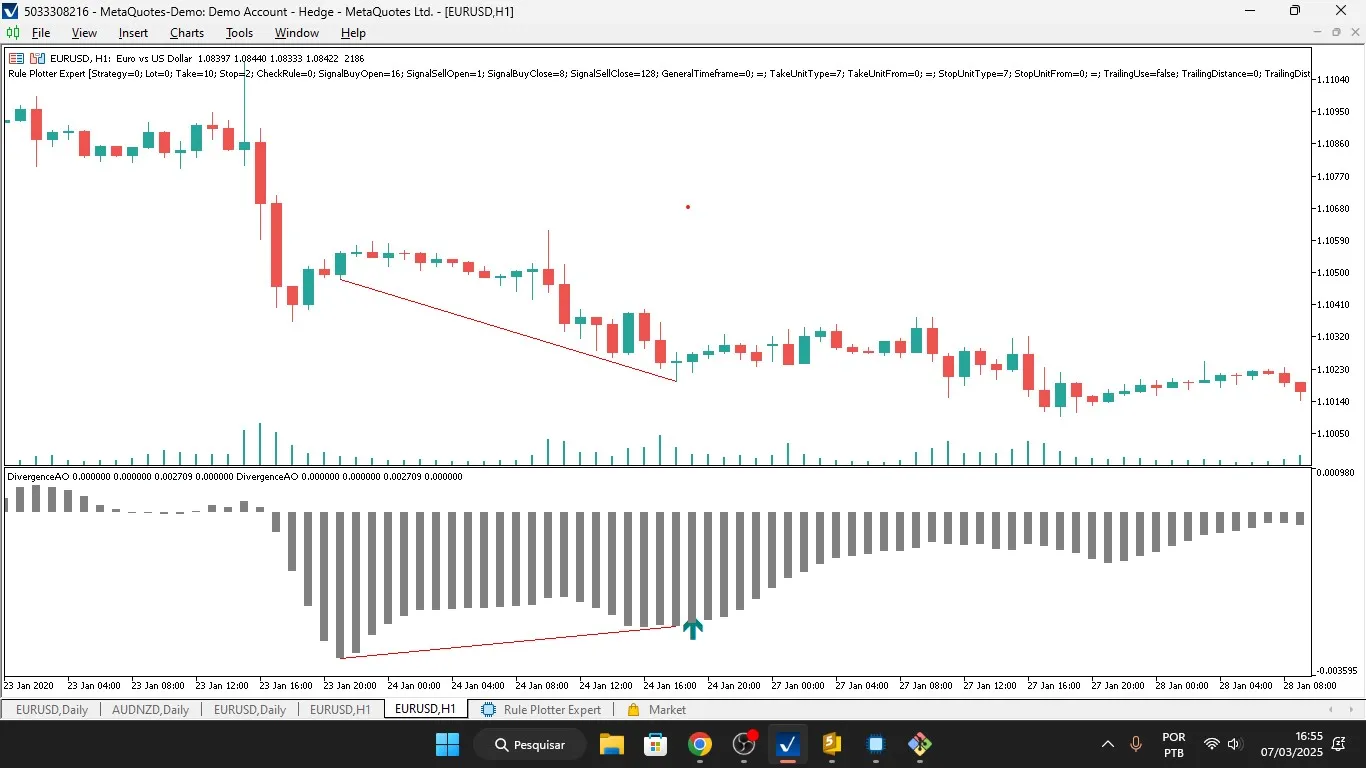
If you’re looking to up your trading game, the Divergence Awesome Oscillator might just be the tool you need. This custom indicator for MetaTrader 5 is designed specifically to spot and visualize divergences between price action and the Awesome Oscillator (AO). Divergences happen when the price and the AO aren't in sync, often hinting at potential market reversals or continuations. This handy indicator plots buy/sell signals, a histogram of the AO, and trendlines to make those divergences pop on your chart.

Key Features of the Indicator:
- Divergence Detection:
- Spot bullish divergences (where the price hits lower lows while the AO makes higher lows).
- Identify bearish divergences (when the price hits higher highs while the AO hits lower highs).
- Visualization:
- Buy/Sell Arrows: Arrows on your chart indicate potential buy or sell signals based on divergences.
- Histogram: The AO values are displayed as a histogram for easy analysis.
- Trendlines: Trendlines help you visualize the divergences between price and the AO.
- Custom Buffers:
- Uses four buffers to store data:
- BuyBuffer and SellBuffer for buy/sell signals.
- HistogramBuffer for AO values.
- PointsCounterBuffer to keep track of aligned points for confirming divergences.
- Uses four buffers to store data:
- Dynamic Trendline Drawing:
- Utilizes CChartObjectTrend to dynamically draw trendlines based on price and AO.
- Crossing Check:
- A function (CheckCrossing) checks if the price or AO crosses a trendline, which can confirm or invalidate a divergence.
- Interpolation:
- Employs linear interpolation (CalculateIntermediateValue) to find intermediate values between two points, aiding in crossing checks.
How It Works:
- Initialization:
- The OnInit() function sets up the indicator buffers, assigns properties like colors and styles, and initializes the AO handle.
- Main Calculation:
- The OnCalculate() function analyzes price and AO data to find divergences:
- Identifies bottoms (lower lows) and tops (higher highs) in both price and AO.
- Compares price and AO trends to check for divergences.
- Plots buy/sell signals and draws trendlines upon confirming a divergence.
- The OnCalculate() function analyzes price and AO data to find divergences:
- Divergence Confirmation:
- Conditions like IsBullishTrend and IsBearishTrend are used to confirm divergences.
- Ensures no crossings between price and AO trendlines to validate the divergence.
- Dynamic Updates:
- The indicator keeps updating with each new bar, recalculating divergences and redrawing trendlines as necessary.
Key Functions:
- IsBottom() and IsTop():
- Detects local minima (bottoms) and maxima (tops) in an array (price or AO).
- CheckCrossing():
- Checks if the price or AO crosses a trendline, which could invalidate a divergence.
- CalculateIntermediateValue():
- Calculates intermediate values using linear interpolation for better trendline analysis.
- AddUniqueCoordinates():
- Makes sure unique coordinates are added for accurate trendline drawing.
- TotalAligned():
- Counts aligned points to confirm the strength of a divergence.
Usage:
- This indicator is ideal for traders who rely on divergence strategies to spot potential reversals or continuations in the market.
- It offers visual cues (arrows, trendlines, and histograms) to help traders make well-informed decisions.
Example Scenario:
- If the price is hitting lower lows (bearish), but the AO is making higher lows (bullish), a bullish divergence is spotted. The indicator will plot a buy arrow and draw trendlines to highlight the divergence.
- On the flip side, if the price is making higher highs (bullish), but the AO is hitting lower highs (bearish), a bearish divergence is detected. The indicator will plot a sell arrow and draw trendlines.
Technical Details:
- Platform: MetaTrader 5 (MT5).
- Language: MQL5.
- Dependencies: Makes use of the Awesome Oscillator (iAO) for calculations.
- Custom Objects: Employs CChartObjectTrend for drawing trendlines and CArrayInt for managing coordinate arrays.
This indicator is a valuable asset for traders looking to automate divergence detection and visualization, streamlining their trading strategies and enhancing accuracy.


Comments 0