Hey fellow traders! Today, I'm excited to introduce you to my first trading indicator, the FXA0 - RSI Crossing 50 with ATR. It's a game-changer for your trading strategy!
Here's how to get started:
- Simply drop the indicator onto your chart. I recommend using it on an H1 or H4 timeframe. If you decide to switch to a daily chart or go below H1, you'll need to tweak the RSI and ATR settings accordingly.
Once it's set up, here's what to look for:
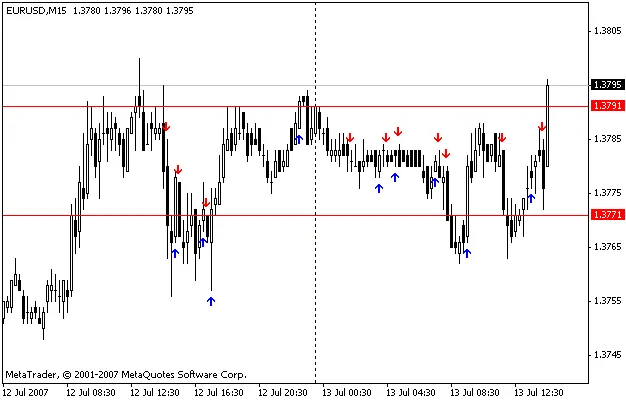
- You’ll see blue arrows signaling long (buy) positions and red arrows for short (sell) positions.
- There are two horizontal lines indicating the most recent position—one for your entry point and another for your stop loss.
- If your entry order gets executed, keep an eye out for a second blue or red arrow. When it appears, consider adding to that position.
- To manage your trades, close one lot using the green check box and the next one when the opposite colored arrow shows up.
Quick tip: If you receive a blue or red arrow that goes against your entry, it's wise to close all orders in that direction and look for opportunities in the opposite direction.
For more insight, check out this article by Jamie Saettele.
Happy trading and enjoy!


Comments 0