Description:
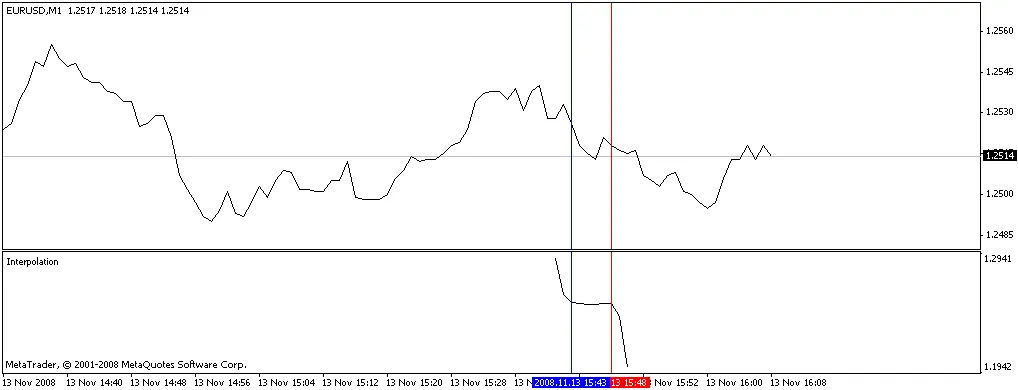
Lagrange's interpolation polynomial is a handy tool for traders, helping to determine a function based on specific data points. Essentially, this indicator uses coordinates from points situated between begin and end (marked by the red and blue lines on the chart) to calculate the coordinates of subsequent points using the Lagrange's interpolation method.
Parameters:
- begin - This marks the starting point on the chart where we begin selecting point coordinates for interpolation. You'll find it indicated by the red line.
- end - This signifies where the selection of point coordinates wraps up, marked clearly by the blue line.
- numPrognoz - This parameter refers to the number of points to the left and right of the begin and end that are calculated using Lagrange's interpolation polynomial.
Illustration:
Important Notes:
- The difference between end and begin determines the degree of the polynomial. For instance, if the distance is two, the resulting chart will take the shape of a parabola; if it's three, expect a hyperbola, and so on.
- It's crucial that begin - numPrognoz remains greater than zero, as the numbers from begin to begin - numPrognoz dictate the number of bars the function will be drawn for. And by the way, does anyone have tips on how to draw on the -1 bar?


Comments 0