The MACD Overlay indicator is a great tool for traders using MetaTrader 5, as it displays the chart with colored candles based on the MACD oscillator data.
Here are the five adjustable parameters you can tweak:
- Data MACD Compare Mode
- MACD and Signal Lines - Compares the MACD line with the signal line.
- MACD vs Zero Line - Evaluates the MACD line in relation to the zero line.
- Current and Previous MACD Values - Compares the current MACD line value to the previous one.
- MACD Fast EMA Period - Sets the calculation period for the fast EMA in the MACD indicator.
- MACD Slow EMA Period - Determines the calculation period for the slow EMA in the MACD indicator.
- MACD Period Signal Line - Adjusts the calculation period for the MACD's signal line.
- MACD Applied Price - Specifies which price to use for the MACD calculations.
MACD and Signal Lines:
- If the MACD line is above the signal line, a bullish candle appears in green, while a bearish candle shows in light green.
- If the MACD line is below the signal line, a bearish candle appears in red, and a bullish candle shows in light red.
MACD vs Zero Line:
- If the MACD line is above zero, a bullish candle shows in green, while a bearish candle appears in light green.
- If the MACD line is below zero, a bearish candle appears in red, and a bullish candle shows in light red.
Current and Previous MACD Values:
- If the MACD line values increase, a bullish candle displays in green, while a bearish candle shows in light green.
- If the MACD line values decrease, a bearish candle displays in red, while a bullish candle shows in light red.
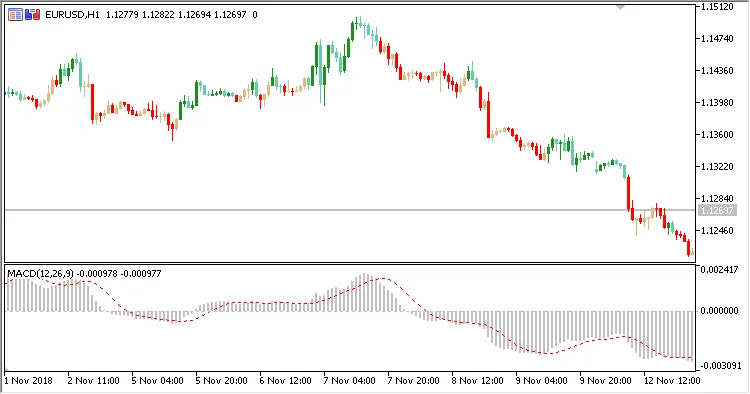
Fig. 1. MACD Overlay + MACD. Data MACD Compare Mode = MACD and Signal Lines

Fig. 2. MACD Overlay + MACD. Data MACD Compare Mode = MACD vs Zero Line
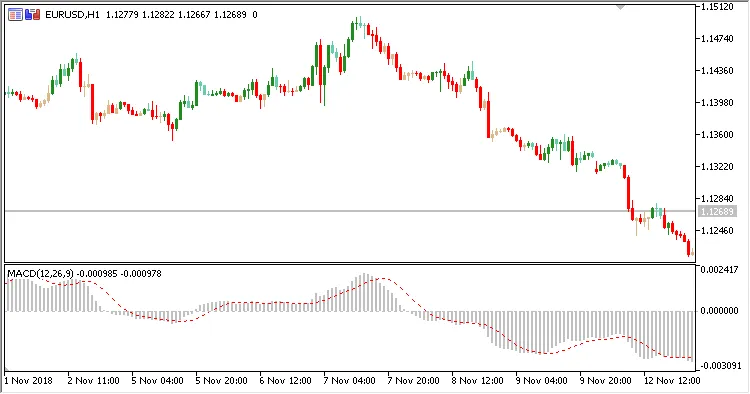
Fig. 3. MACD Overlay + MACD. Data MACD Compare Mode = Current and Previous MACD Values


Comments 0