The Moving Average Convergence Divergence, or MACD, is a powerful trend-following indicator that helps traders identify potential buy and sell opportunities by analyzing the relationship between two moving averages.
Understanding MACD: Moving Average Convergence Divergence
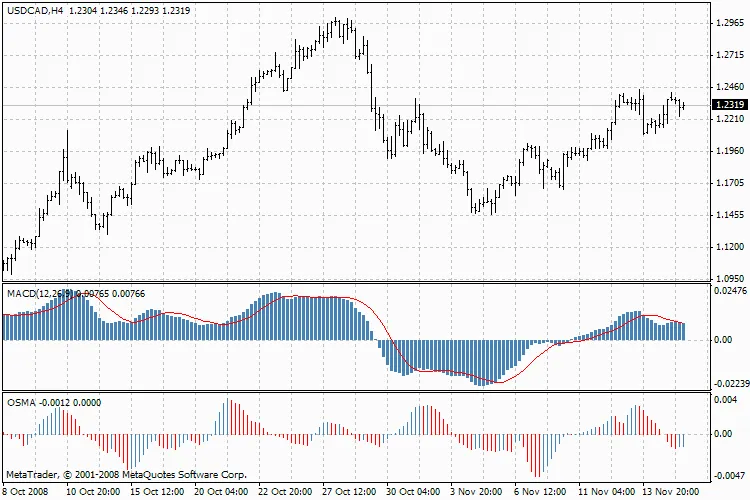
The MACD is calculated by taking the difference between the 12-period and 26-period Exponential Moving Averages (EMAs). To make trading signals clearer, a signal line, which is a 9-period moving average, is plotted on the MACD chart.
MACD shines in volatile markets, and there are three main strategies traders use to leverage this indicator: crossovers, overbought/oversold conditions, and divergences.
Crossovers
The fundamental rule for trading with MACD is straightforward: sell when the MACD crosses below its signal line and buy when it crosses above. Many traders also pay attention to when the MACD line crosses above or below zero as a signal to enter or exit trades.
Overbought/Oversold Conditions
Another way to use MACD is to gauge overbought or oversold conditions. If the MACD rises sharply, indicating the shorter moving average is pulling away from the longer one, it might suggest that the security is overbought and due for a correction back to more realistic price levels.
Divergence
Divergence between the MACD and the security price can hint at a potential trend reversal. A bullish divergence occurs when the MACD reaches new highs while the security fails to do so. Conversely, a bearish divergence is when the MACD hits new lows while the price does not. These divergences carry more weight when they happen at overbought or oversold levels.
Calculating MACD
To calculate MACD, subtract the 26-period EMA from the 12-period EMA. Then, plot a 9-period simple moving average of the MACD, which serves as the signal line:
MACD = EMA(CLOSE, 12) - EMA(CLOSE, 26)
SIGNAL = SMA(MACD, 9)
Where:
EMA — Exponential Moving Average;
SMA — Simple Moving Average;
SIGNAL — the signal line of the MACD.
Learn More About MACD
If you want a deeper dive into MACD, check out the full description in the Technical Analysis: Moving Average Convergence/Divergence.


Comments 0