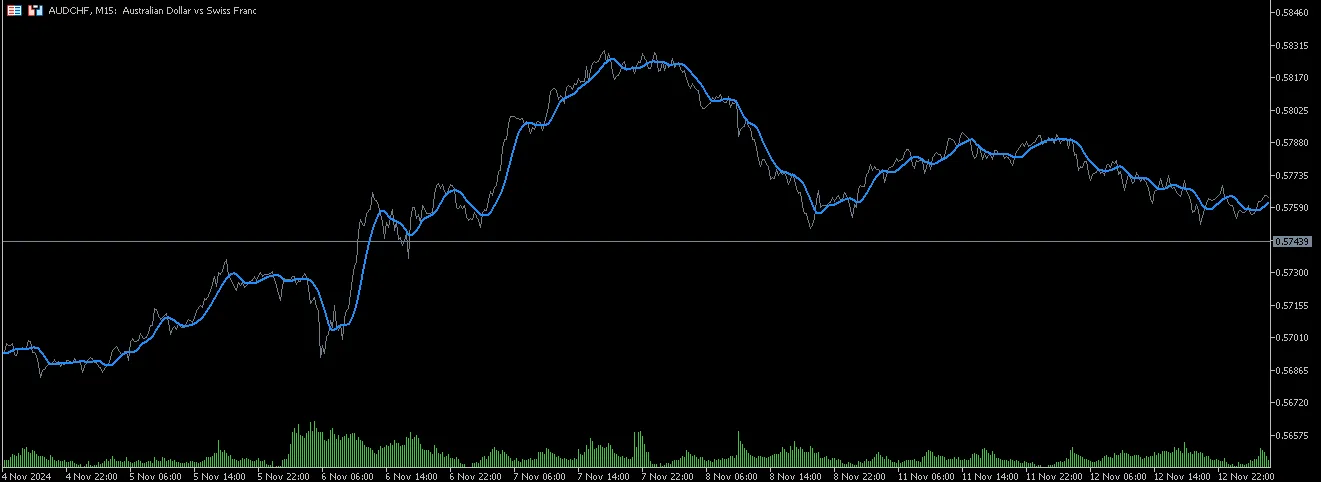
Hey there, fellow traders! Today, let’s dive into a nifty tool that can help you refine your trading strategy — the Volume Weighted Line Chart. This indicator is designed to smooth out your line charts while leveraging tick volume to give you a clearer picture of market direction.
The core idea behind this indicator is simple: it reveals the genuine direction the market is heading. Unlike standard line charts, this tool filters out those pesky short-term market fluctuations that can throw off your analysis. Plus, you can tweak the smoothing settings in the input to suit your trading style.
To make things even clearer, some graphical elements are added to highlight market direction. This helps in visualizing trends much better.
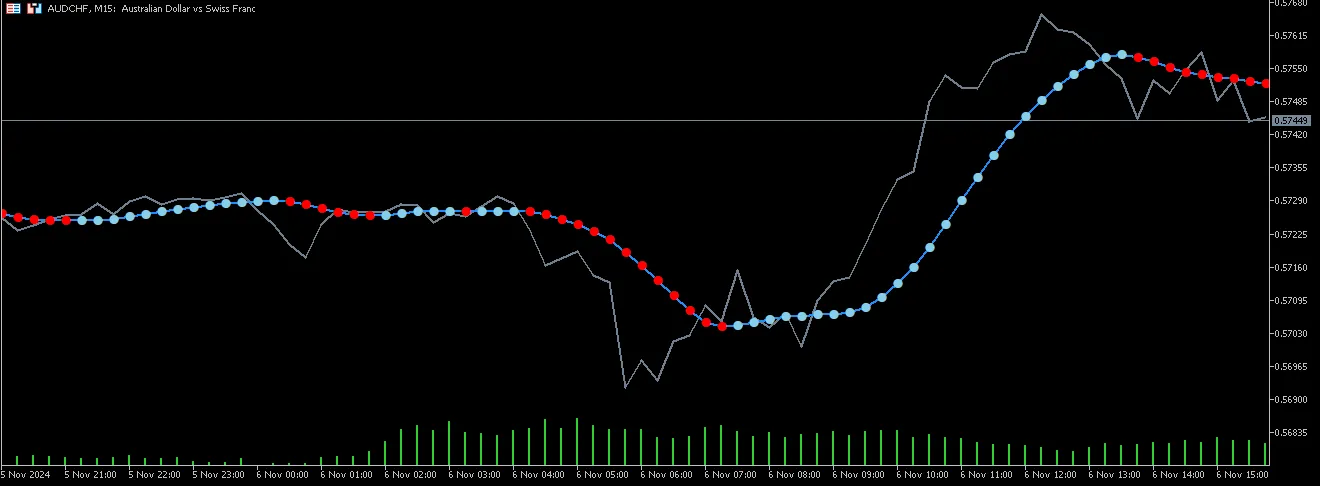
Pro tip: It’s wise to hold off on making any trades when the line flattens out. Horizontal movements often signal indecision in the market, which can lead to false signals.


Comments 0