Hey traders! Today, we’re diving into how to enhance your trading strategy using the RSIColored_v1 and DivPeakTroughRSI_SW indicators. These tools can really help you spot trends and reversals, so let’s get right into it!
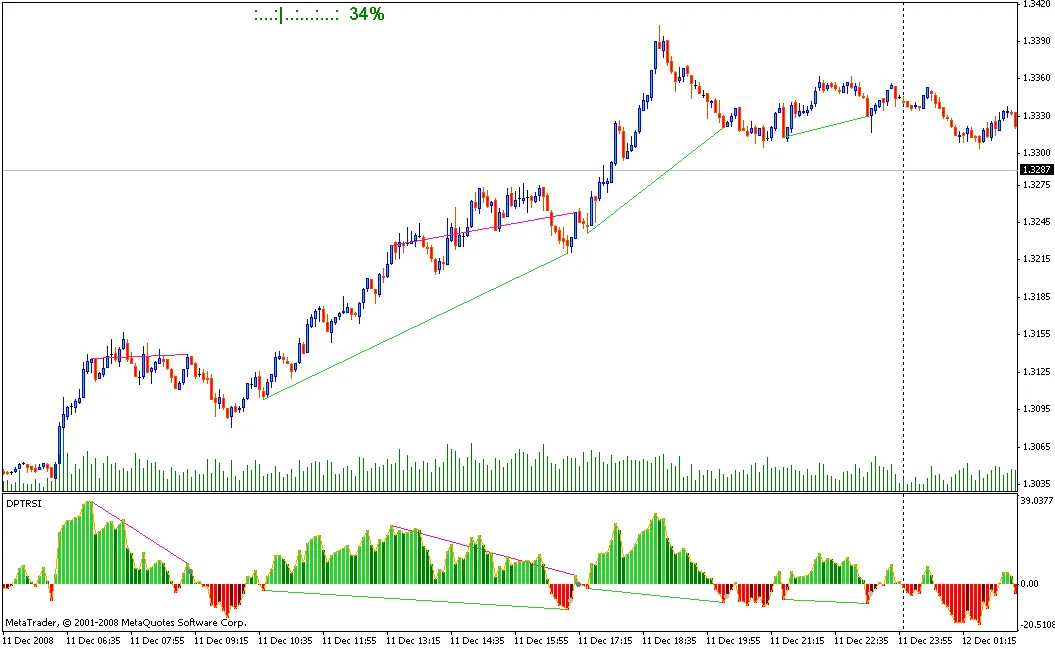
First things first, go ahead and attach the RSIColored_v1 to your chart. This indicator provides a visually appealing way to track the Relative Strength Index (RSI), making it easier to identify overbought and oversold conditions.
Next, you’ll want to bring the DivPeakTroughRSI_SW into the same window. Just drag it in using your mouse, and voila! You now have both indicators working together to give you a comprehensive view of market momentum.
Using these indicators in tandem can help you make more informed trading decisions. They’re not just pretty charts; they deliver valuable insights into price action that can set you up for success.
Happy trading!
- Attach RSIColored_v1 to your chart.
- Drag DivPeakTroughRSI_SW into the same window.
- Use both indicators for better market analysis.


Comments 0