Changelog:
- Version 1.07: Now you can manage trendlines with alerts and color options, set to ON by default.
- Version 1.06: You can easily move the label of a line with a double-click. Also, alert messages have been updated.
- Version 1.05: Choose between two line styles and adjust their widths.
- Version 1.04: Code improvements courtesy of pwalkz.
- Version 1.03: Fixed a bug related to line styles.
- Version 1.02: Bug fixes for alert functionalities.
How to Use:
To create a support or resistance line, simply hover your mouse where you want it, then hit the "A" key (if you're using the default setting). The line will pop right up, and you can repeat this as often as you like.
Each line will be drawn in the color and style you've set in the parameters.
By default, if the price crosses a line, you'll receive an alert or a smartphone notification, depending on your preference.
You can now use a secondary line as well. Use the first line for major support and resistance levels, and the second one for alerts or smaller levels. If you need more, just let me know!
- This tool helps you easily create horizontal lines by simply hitting a key on your keyboard, placing the line exactly where your mouse is.
- You can create as many lines as you want.
- You can choose two colors: one for your support line and another for your resistance line.
- You can quickly delete the last line with a keystroke and remove as many lines as you need.
- Set an alarm so that when a support or resistance line is crossed, the indicator will send an alert on your screen or to your smartphone if push notifications are enabled.
- Use the same window to view different charts; the indicator automatically hides support and resistance lines from other symbols and shows them again when you return to the original symbol.
- The color of the line is automatically determined: it turns into a resistance line color if it's above the market price and a support line color if it's below.
- See the price at your mouse position in the top left corner as a comment, or opt for a floating box instead.
- On the line, you can check the number of pips separating the line from the current price. Hover over it to see the exact price.
- Clicking on the label of the line reveals how many times it has acted as support or resistance and how often it has been crossed. You can adjust the history count, with a default of 200 candles in your timeframe—be it 200 minutes on M1 or 200 months on MN. I’ve tested it up to 2000, and it works just fine. If a candle closes within 10 pips, it will count in the support and resistance history, but you can tweak this number in MaxDeviation.
Parameters:
externstring  LineHorizontal="A";              //Key to Create a SR Line (1)
externcolor   LineResistcolor=clrDodgerBlue;   //Resistance Line Color (1)
externcolor   LineSupportcolor=clrDarkOrange;  //Support Line Color (1)
externENUM_LINE_STYLE  LineStyle=STYLE_SOLID;  //Style of SR Lines (1)
externint     Linewidth=1;                     //Choose the width of the line (1)

externstring  LineHorizontalSecond="Q";              //Key to Create a SR Line (2)
externcolor   LineResistcolorSecond=clrDodgerBlue;   //Resistance Line Color (2)
externcolor   LineSupportcolorSecond=clrDarkOrange;  //Support Line Color (2)
externENUM_LINE_STYLE  LineStyleSecond=STYLE_DOT;    //Style of SR Lines (2)
externint     LinewidthSecond=1;                     //Choose the width of the line (2)
extern bool    TakecareManualTrendline=true;          //Take care of your Trendline added manually

externstring  DeleteLastLine="X";                  //Key to Delete Last SR Line
externbool    AlarmCrossWhithAlert=true;           //Send an Alert
externbool    AlarmCrossWhithPushSmartphone=true;  //Send a Notification

externbool    MagnetLinePriceOnFullPip = true; //To make a line at 1.1500 even if the mouse is at 1.15002
externdouble  DefaultLotSize=0.1;              //Lot Size to Calc Money Values
externint     history=200;                     //Number of candles to check, could be 200 minutes or 200 weeks depending on your timeframe
externint     MaxDeviation=10;                 //If the candle stops at less than 10 pips it will appear in the history of support and resistance
externcolor   Textcolor=clrRed;                //Color of mouse position and history
externbool    Commentornot=true;               //You can choose to see mouse and history of support/resistance in the comment or in positionable label
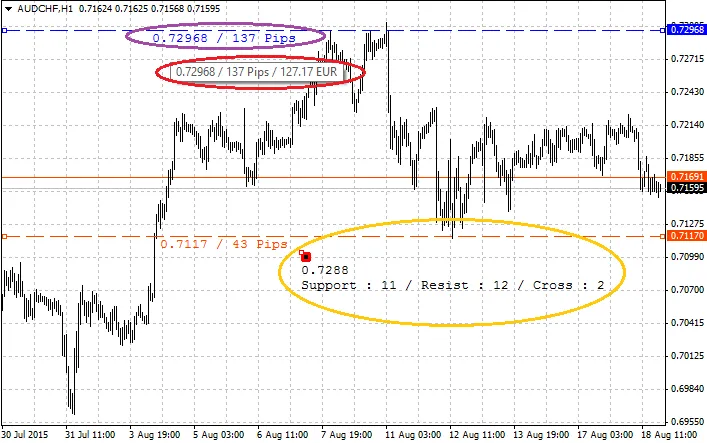
In the image above, the purple indicates the number of pips separating the actual price. When you hover over the label or the line, the value will display using your default lot size.
The yellow floating box can be moved around your chart, providing information about the mouse price and history. Clicking on a line's label reveals the line's history.
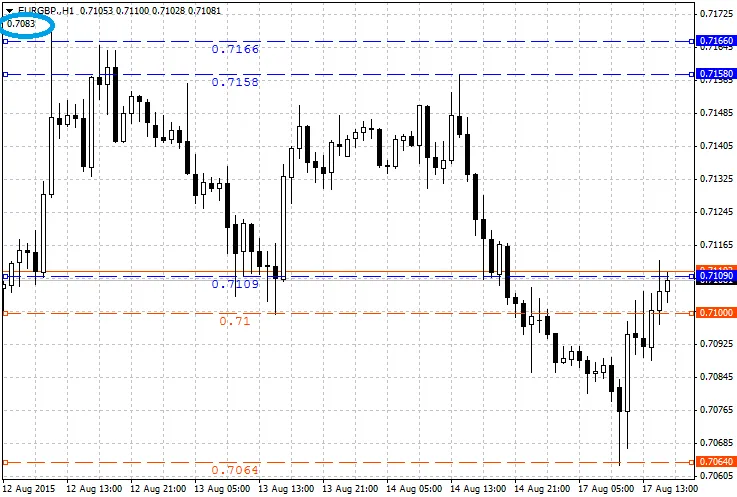
In the blue circle, you can see the price at your mouse cursor position. The line was created in a matter of seconds, with the style and color adjusting automatically.
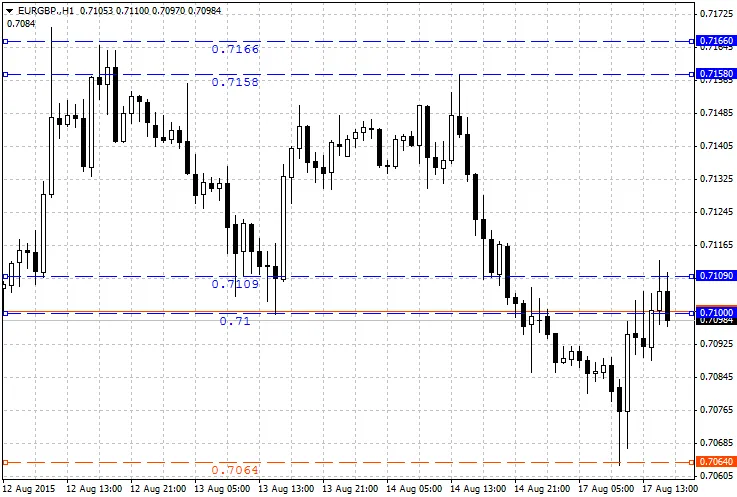
In this example, the line at 0.71 changes color when the price dips below it, and an alert is sent via the MetaTrader alert box. You can opt for smartphone notifications or both.
If you have any other ideas or suggestions, feel free to share!


Comments 0