Hey fellow traders! Today, let’s dive into a handy tool that can really sharpen your trading game—the Support and Resistance Indicator for MetaTrader 4. If you’ve ever struggled to pinpoint those critical levels, this might just be the solution you've been looking for.
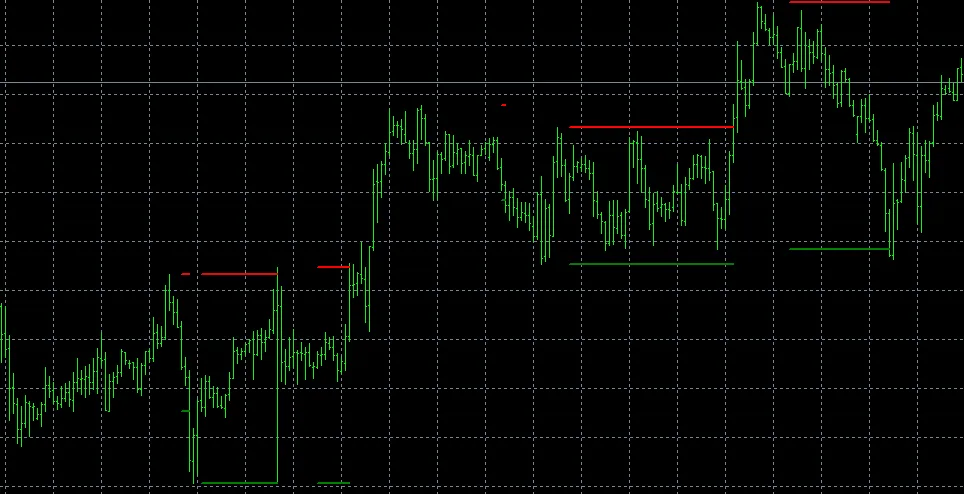
The core concept here is simple: this indicator helps you identify support and resistance levels, which are essential for making informed trading decisions. Unlike many other indicators out there, this one is straightforward and effective. It calculates and displays these levels directly on your chart, and the best part? If the price fluctuates between these levels, they stay put, giving you a reliable reference as you trade.
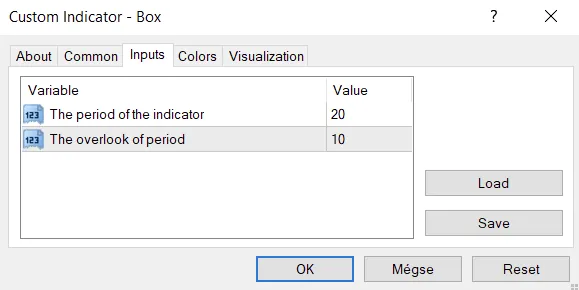
Now, let’s talk about how it works. There are two main input parameters you’ll want to adjust: Period and Overlook. The indicator scans for the highest and lowest prices, ensuring they’re the highest or lowest over the last (Period) bars and also over the (Period + Overlook) bars. If it identifies both a peak and a trough, it marks them on your chart.
One thing to keep in mind is that the i parameter in the OnCalculate function should always start from the sum of Period and Overlook. This ensures that the calculations are accurate and up to date.
I recommend setting your parameters to: Period: 20 and Overlook: 10. This configuration has worked well for many traders, but feel free to tweak it based on your trading style.


Comments 0