Welcome to the BB MACD Indicator for MetaTrader 4! This powerful tool is a variation of the classic MACD (Moving Average Convergence Divergence) indicator, designed to help you spot trend changes and gauge the strength of ongoing trends. You’ll find it displayed in a separate window on your chart, featuring two lines (one blue and one red) and dots that can appear in either green or magenta. Keep an eye on those dot color changes—they're your best friend when it comes to identifying potential trading signals. Plus, the gap between the two lines offers insight into the trend's strength. Good news: this indicator is available for both MT4 and MT5!
Input Parameters
- FastLen (default = 12) — This sets the period for the fast moving average, which is the lower period used in the dot calculations.
- SlowLen (default = 26) — This is the period for the slow moving average, the higher period involved in the dot calculations.
- Length (default = 10) — This parameter controls the period for the moving average and standard deviation indicators used in the line calculations.
- barsCount (default = 400) — This sets the maximum number of bars on the chart that will be considered for calculations.
- StDv (default = 2.5) — This is the weight multiplier for the standard deviation indicator, balancing its role in calculations against the moving average.
- EnableNativeAlerts (default = false) — Set to true to activate MetaTrader's native pop-up alerts when the BB MACD color changes.
- EnableSoundAlerts (default = false) — Set to true to receive sound alerts upon BB MACD color changes.
- EnableEmailAlerts (default = false) — Set to true to have email alerts sent when the BB MACD color changes. Ensure your email settings are configured in MetaTrader under Tools -> Options -> Email.
- EnablePushAlerts (default = false) — Set to true to receive push notifications on your device when the BB MACD color changes. Make sure to configure notifications in MetaTrader via Tools -> Options -> Notifications.
- SoundFileName (default = "alert.wav") — This is the sound file that will play for alerts if EnableSoundAlerts is set to true.
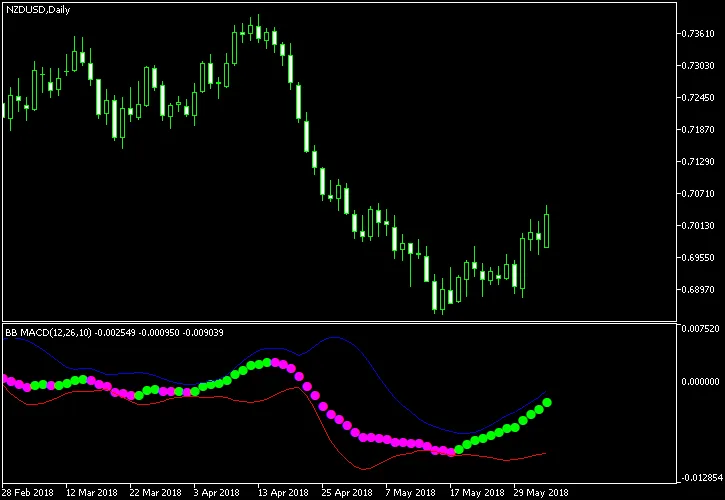
As illustrated in the chart example, a buy signal occurs when the magenta dots turn green, while a sell signal is triggered when the green dots switch to magenta. For optimal trading, look for situations where both the blue and red lines are relatively wide apart.


Comments 0