Get to Know the Bollinger Squeeze Advanced Indicator for MetaTrader 4 — this powerful tool is a must-have for any serious trader. It combines two key elements:
- A measure of trending strength derived from both Bollinger Bands and the Keltner Channel 'squeeze'.
- A histogram that indicates the trend direction and strength using one of eight oscillators: Stochastic, CCI, RSI, MACD, Momentum, Williams % Range, ADX, or DeMarker.
This indicator appears in a separate window on your chart as a histogram. The color and width of its bars provide additional insights into market conditions. Plus, it supports multi-timeframe (MTF) functionality and comes with all sorts of alerts. You can use it on both the MT4 and MT5 versions of the trading platform.
The Bollinger Squeeze Advanced is part of the Not So Squeezy Indicator System.
Input Parameters
- Timeframe (default = Current) — Choose the timeframe you want to draw data from. This indicator can display higher timeframe data on a lower timeframe chart.
- Trigger Type (default = DeMarker) — The oscillator you want to use for the trend measurement histogram.
- Stochastic Period (default = 14) — The period setting for the Stochastic indicator, if selected via Trigger Type.
- CCI Period (default = 50) — The period for the CCI indicator when chosen through Trigger Type.
- RSI Period (default = 14) — The period for the RSI indicator, set via Trigger Type.
- MACD Fast EMA Period (default = 12) — The fast EMA period for the MACD indicator, if selected through Trigger Type.
- MACD Slow EMA Period (default = 26) — The slow EMA period for the MACD indicator.
- MACD Signal Line Period (default = 9) — The signal line period for MACD.
- Momentum Period (default = 14) — The period for the Momentum indicator, if chosen through Trigger Type.
- Williams % Range Period (default = 24) — The period for the Williams % Range indicator.
- ADX Period (default = 14) — The period for the ADX indicator.
- DeMarker Period (default = 13) — The period for the DeMarker indicator.
- Alert on Sideways Trending (default = false) — If true, you’ll get alerts when the market shifts from Trending to Sideways or the other way around.
- Alert on Zero Cross (default = false) — If true, you’ll receive alerts when the histogram crosses the zero line or defined levels.
- Alert Above Level (default = 0) — Set an alert level for when the indicator's value rises above it.
- Alert Below Level (default = 0) — An alert level for when the indicator's value dips below it.
- Enable Native Alerts (default = false) — If true, the indicator will use MetaTrader's built-in pop-up alerts.
- Enable Email Alerts (default = false) — If true, the indicator will send alerts via email (ensure your MetaTrader email settings are configured in Tools -> Options -> Email).
- Enable Push Alerts (default = false) — If true, you’ll receive push notifications (check your settings in Tools -> Options -> Notifications).
- Trigger Candle (default = Previous) — Choose the candle to issue alerts on: Previous for the most recently closed candle or Current for the unfinished candle.
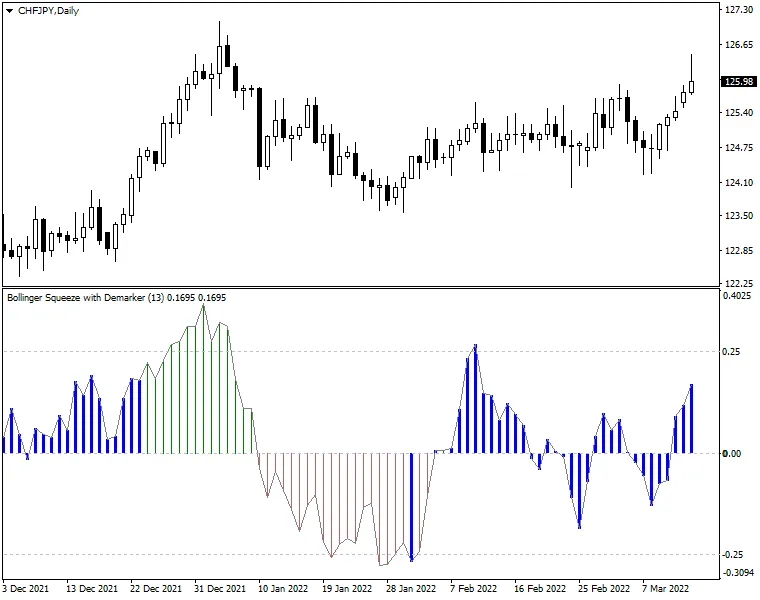
The indicator uses one of the eight oscillators to assess the trend's strength and direction, displaying this as a histogram:
- Green bars above the zero line indicate uptrends.
- Red bars below the zero line signal downtrends.
Moreover, the Bollinger Squeeze Advanced offers a built-in measure of volatility within the main histogram. When the Bollinger Squeeze indicates a sideways market (i.e., when the Bollinger Bands are enclosed within the Keltner Channel), you'll see the histogram bars switch to thick blue.
The key takeaway with this indicator is to identify trading ranges during non-trending market phases (marked by blue histogram bars) and to position yourself for breakouts when the bars revert to normal. The histogram will give you a sense of the trend's strength and signal when it’s time to exit as the trend starts to weaken.


Comments 0