Bollinger Squeeze Basic MetaTrader Indicator is a powerful tool designed for traders who want to harness the dynamics of Momentum, Bollinger Bands, and the Keltner Channel. This indicator operates in a separate window on your chart, providing a Momentum histogram and a series of dots that illustrate the relationship between the current Bollinger Bands and Keltner Channel values. It's compatible with both MT4 and MT5 platforms, making it a versatile choice for traders at any level.
Bollinger Squeeze Basic is a key component of the Not So Squeezy indicator system, offering you a unique edge in your trading strategy.
Input Parameters
- MaxBars (default = 300) — the maximum number of bars the indicator will analyze on the chart.
- BB_Period (default = 20) — the period setting for the Bollinger Bands.
- BB_Deviation (default = 2.0) — the deviation factor for the Bollinger Bands.
- Keltner_Period (default = 20) — the period for the Keltner Channel.
- Keltner_Factor (default = 1.5) — the multiplication factor for the Keltner Channel.
- Momentum_Period (default = 12) — the period for the Momentum indicator.
- EnableNativeAlerts (default = false) — if true, you'll receive MetaTrader's native pop-up alerts when the BB/Keltner arrows change color.
- EnableEmailAlerts (default = false) — if true, email alerts will be sent when the BB/Keltner arrows change color. Make sure your email settings are configured correctly in MetaTrader via Tools -> Options -> Email.
- EnablePushAlerts (default = false) — if true, push notifications will be sent to your device when the BB/Keltner arrows change color. Ensure notifications are set up in MetaTrader via Tools -> Options -> Notifications.
- TriggerCandle (default = Previous) — the candle that triggers alerts: Previous for the last closed candle or Current for the ongoing candle.
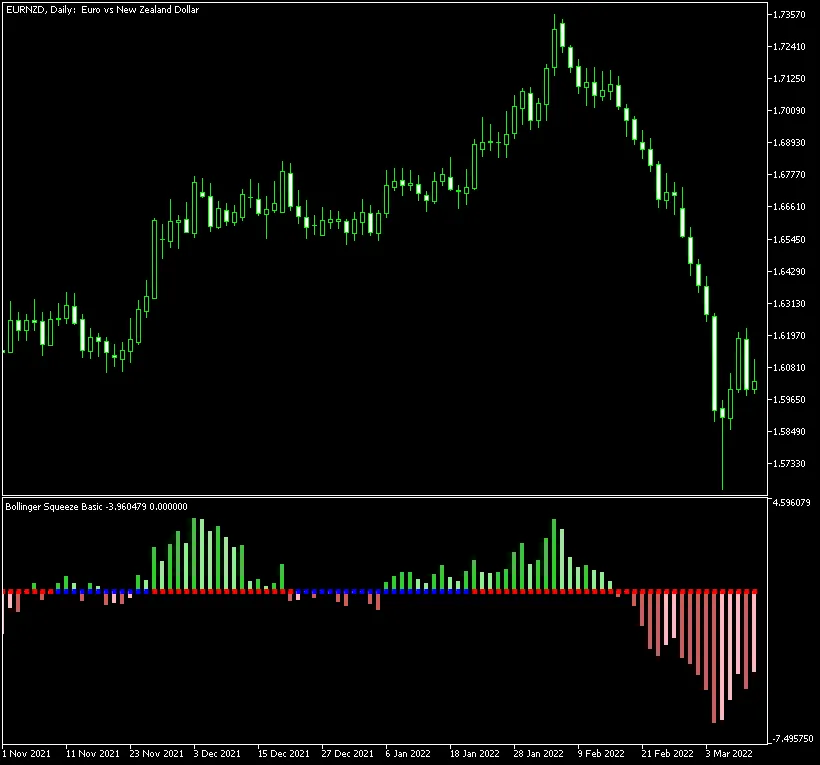
This indicator leverages Momentum to gauge the strength and direction of trends:
- Rising momentum above the zero line (indicating an uptrend) is shown with darker green bars.
- Falling momentum above the zero line (still an uptrend) is depicted with lighter green bars.
- Rising momentum below the zero line (downtrend) is marked with darker red bars.
- Falling momentum below the zero line (also downtrend) is indicated with lighter red bars.
Moreover, the Bollinger Squeeze Basic offers a fascinating measure of volatility directly within the main histogram. The blue and red squares on the zero line reveal the current interaction between the Bollinger Bands and the Keltner Channel:
- If the squares are red, it suggests that the Bollinger Bands are outside the Keltner Channel, indicating strong market trends.
- If the squares are blue, it shows that the Bollinger Bands are contained within the Keltner Channel, suggesting a sideways market.
The core idea of this indicator is to identify trading ranges during non-trending market phases (represented by blue squares) so you can position yourself for breakouts when the market shifts to a trending phase (indicated by red squares). The histogram not only indicates the current trend's strength but also signals when it's time to exit as the trend weakens.


Comments 0