Hey there, fellow traders! Today, I want to dive into the BTF_ATR, a fantastic multi-timeframe Average True Range (ATR) indicator that can give you a solid edge in your trading strategy. This nifty tool displays three ATRs from higher timeframes right on your current chart, making it easier than ever to gauge market volatility.
The BTF_ATR comes with five input parameters that you can customize:
- ATR period - This is the period used for calculating the ATR.
- First ATR timeframe - Select the timeframe for the first ATR here.
- Second ATR timeframe - Choose the timeframe for the second ATR.
- Third ATR timeframe - Pick the timeframe for the third ATR.
- Drawing mode - This lets you choose how the indicator is displayed:
- Steps - Displays the ATR as a ladder.
- Slope - Connects the ATR values with inclined lines between bars of the calculation timeframe.
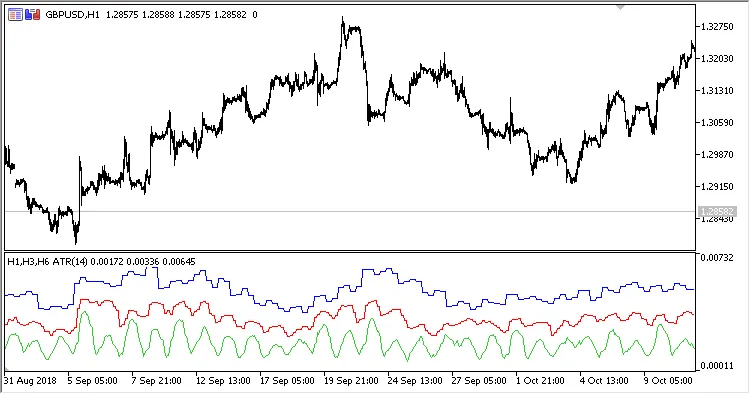
Fig.1. Three Bigger Time Frame ATR. H1, H3, and H6 ATRs displayed on the H1 chart, Drawing mode = Steps
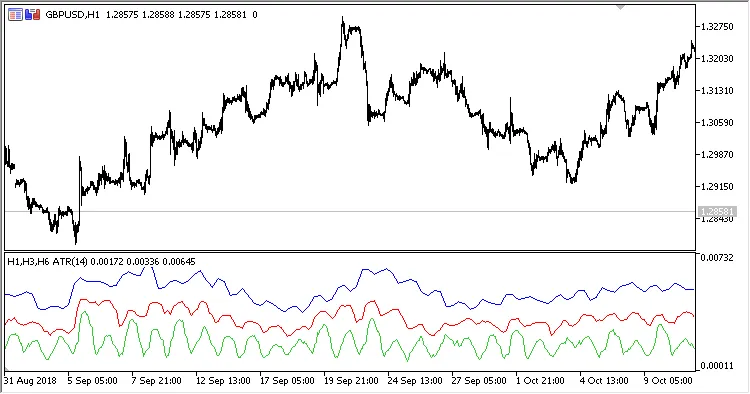
Fig.2. Three Bigger Time Frame ATR. H1, H3, and H6 ATRs displayed on the H1 chart, Drawing mode = Slope
Utilizing the BTF_ATR can enhance your market analysis by providing insights into volatility across different timeframes. So, give it a try and see how it fits into your trading arsenal!


Comments 0