Description:
The Clear Method Indicator is a powerful tool for traders, drawing inspiration from Ron Black's insightful article, Getting Clear With Short-Term Swings.
For additional tips, check out Traders Tips.
Setting up colored candle charts is straightforward. Just follow these steps:
- Switch to a Line Chart.
- In the Chart Properties window, set the Line Chart Color to None (this will hide the entire price graph).
- Copy the ClearMethod.mq4 file into your Indicators directory; this will be utilized by iCustom();
- Add ClearMethodCandles1 (make sure this is the first one), followed by ClearMethodCandles2 to your chart.
- If your chart has a black background, set the IsBlackChart parameter to true for both indicators.
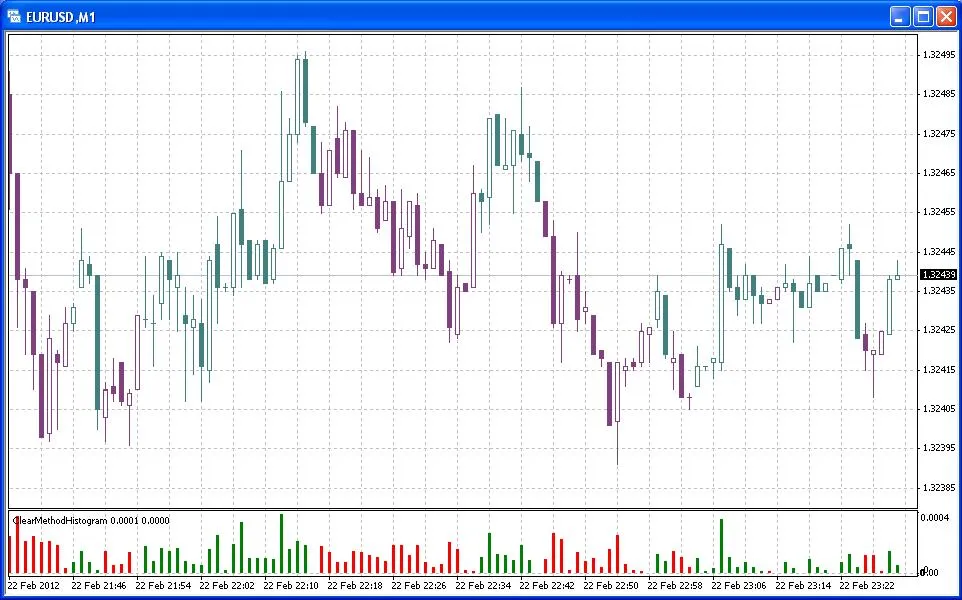
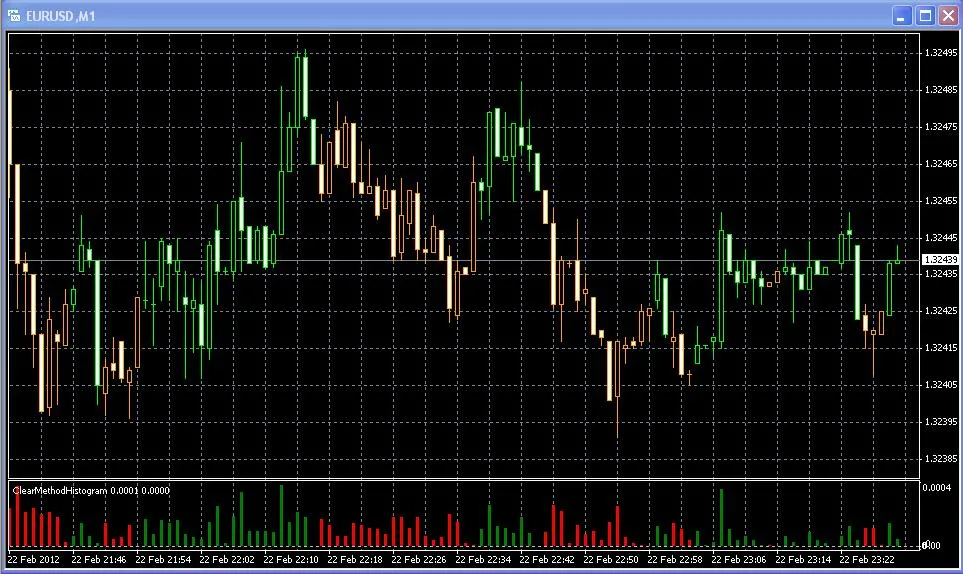
The histogram will indicate the distance from the actual switching threshold, providing valuable insights.
Here are the signals you can expect from ClearMethodSignals.mq4:
- Clear signal (x): This occurs when the Clear Line is broken, causing the candles to change color.
- Move signal (arrow): The Clear Line will shift again after a flat period (see the images below).
- Alert: You will receive an alert after a bar closes, at the first tick of the next bar.
You also have the option to toggle the drawings and alerts individually.
Images:
![]()


Comments 0