Features and Functionality
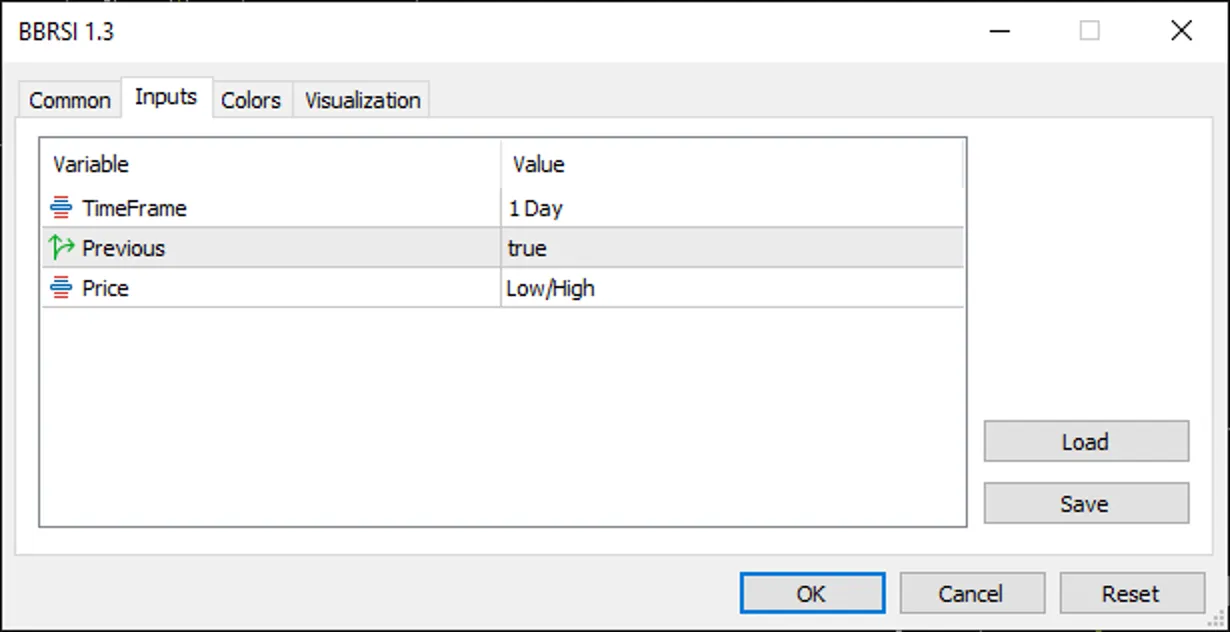
The DailyHighLow indicator is a handy tool that plots two essential lines on your chart: one for the high price and another for the low price, based on user-defined settings. Here are its standout features:
Customizable Timeframe: You can choose your preferred timeframe—be it daily, hourly, or something else—using the TimeFrame setting, which defaults to PERIOD_D1 (daily). The indicator makes sure that the selected timeframe is not smaller than your current chart timeframe, keeping your data accurate.
Price Calculation Options: With the Price input, you can select from three modes:
Low/High (DHL_LOWHIGH): This option shows the highest and lowest prices of your chosen timeframe.
Open/Close (DHL_OPENCLOSE): This mode plots the highest and lowest of the open and close prices.
Close/Close (DHL_CLOSECLOSE): Here, you’ll see the highest and lowest closing prices.
Previous Period Option: The Previous setting (default: true) lets you display the high/low values from the previous period, which can be great for historical analysis.
Visual Customization: The indicator uses solid silver lines for both the high and low plots, with a width of 1, providing clear visibility without cluttering your chart.
How It Works
The indicator kicks into gear by initializing two buffers—HighBuffer and LowBuffer—to store and display high and low price levels. During initialization (OnInit), it sets these buffers and checks the timeframe. The heart of the operation lies in the OnCalculate function, processing price data for each bar:
Data Preparation: It sets up arrays for time, open, close, high, and low prices for reverse indexing.
Timeframe Alignment: The indicator calculates bar shifts using iBarShift to ensure alignment with your chosen timeframe.
Price Calculation:
For DHL_LOWHIGH, it directly retrieves high and low prices using iHigh and iLow.
For DHL_OPENCLOSE and DHL_CLOSECLOSE, it finds the highest/lowest open or close prices in the timeframe using iHighest and iLowest.
Previous Period Handling: If the Previous option is enabled, calculations shift to the earlier period, offering historical context.
Optimization: The indicator limits calculations to new or updated bars (limit) for efficiency, avoiding unnecessary processing.
Practical Applications
The DailyHighLow indicator is perfect for traders using strategies based on critical price levels, such as:
Support and Resistance: Spotting daily or custom timeframe high/low levels to identify breakout or reversal opportunities.
Trend Analysis: Assessing current price action against previous highs and lows to determine market direction.
Risk Management: Setting stop-loss or take-profit levels based on significant price points.
Usage Instructions
Installation: To get started, add the indicator to your MetaTrader 5 platform by copying the code into the MQL5/Indicators folder and compiling it.
Configuration:
Set your desired TimeFrame (like PERIOD_D1 for daily levels).
Choose a Price mode (DHL_LOWHIGH, DHL_OPENCLOSE, or DHL_CLOSECLOSE) that aligns with your trading strategy.
Toggle the Previous option to switch between current and previous period data.
Chart Application: Simply attach the indicator to any chart, and you’ll see two silver lines indicating the high and low levels.
Conclusion
The DailyHighLow indicator is an effective tool for MQL5 traders, offering flexibility in terms of timeframe and price calculation methods. Its lightweight nature and efficient processing make it a great fit for both novice and seasoned traders looking to step up their technical analysis game.
Feedback
If you have any suggestions or run into issues, please drop a comment on the MQL5 CodeBase page or connect with me through the MQL5 community. Your feedback is crucial for enhancing this tool!
Contact me: MQL5 Link


Comments 0