Author: TrendLaboratory
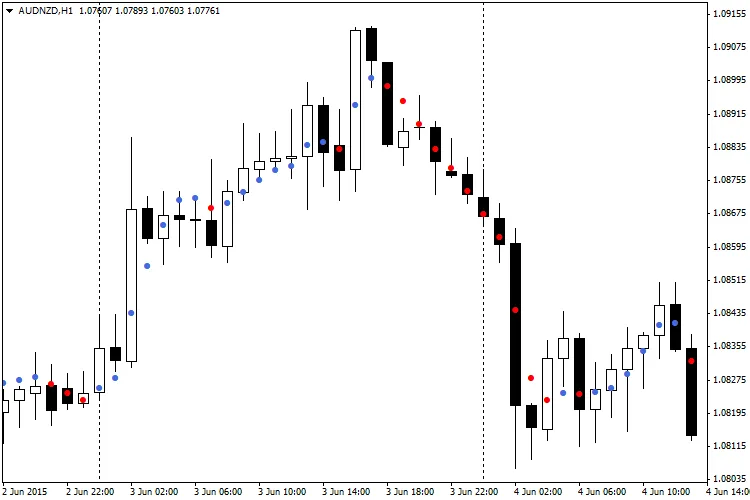
The Dots indicator, developed by TrendLaboratory back in 2006, is a handy tool for traders looking to identify current market trends at a glance. It works by placing colored dots directly on your main chart: blue dots signal an uptrend, while red dots indicate a downtrend. This visual cue can help you make quick decisions in the fast-paced trading environment.
While the Dots indicator doesn’t rely on standard indicators found in MetaTrader, it cleverly uses the iMA (Moving Average) function to analyze prices like Open, Close, Maximum, Minimum, and Typical. The calculation hinges on the cosine of a price change angle. Plus, you can tweak a few input parameters to tailor it to your trading style.
Input Parameters:
- Length (default = 10) — This sets the indicator period. Keep in mind that a higher value increases the time lag, resulting in fewer false signals.
- AppliedPrice (default = PRICE_CLOSE) — This determines which price type the indicator will use for its calculations.
- Filter (default = 0) — A nifty parameter that helps filter out price spikes without causing additional display lags.
- Deviation (default = 0) — This controls the vertical shift of the indicator on your chart.
- Shift (default = 0) — This parameter allows for a horizontal shift of the indicator.
Recommendations:
- The best practice is to wait for two identical dots before opening a position in the direction of the trend. However, be mindful that this strategy isn’t foolproof. An alternative approach is to use a single dot as a signal, especially with the Filter parameter set to Spread x 3, which can help you avoid false entries.


Comments 0