Hey traders! Today, let's dive into the DS Stochastic Indicator, a unique twist on the classic Stochastic Oscillator that incorporates EMA smoothing. If you're looking to sharpen your trading strategy, this tool might just be what you need!
The DS Stochastic Indicator simplifies the visual representation of the Fast Stochastic by displaying two lines: %K and %D. Understanding how these lines interact can give you valuable insights into market trends.
How the DS Stochastic Works
Here’s the formula that drives the Fast Stochastic calculations:
- DIF1(i) = EMA(Close(i) - MaxHigh(N), S);
- DIF2(i) = EMA(MaxHigh(N) - MinLow(N), S);
- %K(i) = 100 * DIF1(i) / DIF2(i);
- %D(i) = 100 * EMA(DIF1(i), P) / EMA(DIF2(i), P);
Let’s break this down a bit:
- Close(i): The closing price of the current bar;
- MaxHigh(N): The highest price over the last N periods;
- MinLow(N): The lowest price over the last N periods;
- EMA: This stands for Exponential Moving Average;
- N: The number of periods you’re analyzing;
- S: The smoothing period for %K(i);
- P: The smoothing period for %D(i).
Visual Representation
Here's a snapshot of the DS Stochastic Indicator in action:
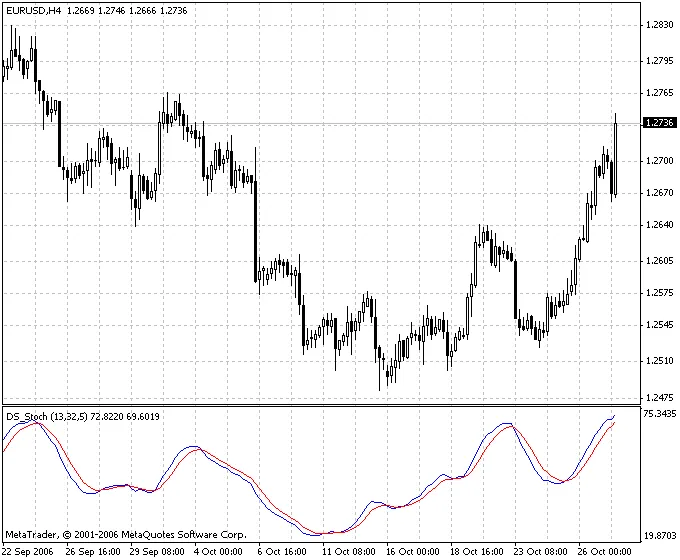
By using the DS Stochastic Indicator, you'll be able to make more informed trading decisions. Remember, the key is to look for divergences and crossovers to gauge potential market reversals. Happy trading!


Comments 0