
To visualize the graph correctly, make sure to use Heiken Ashi or adjust the parameters to bring the graph to the forefront of your indicators.
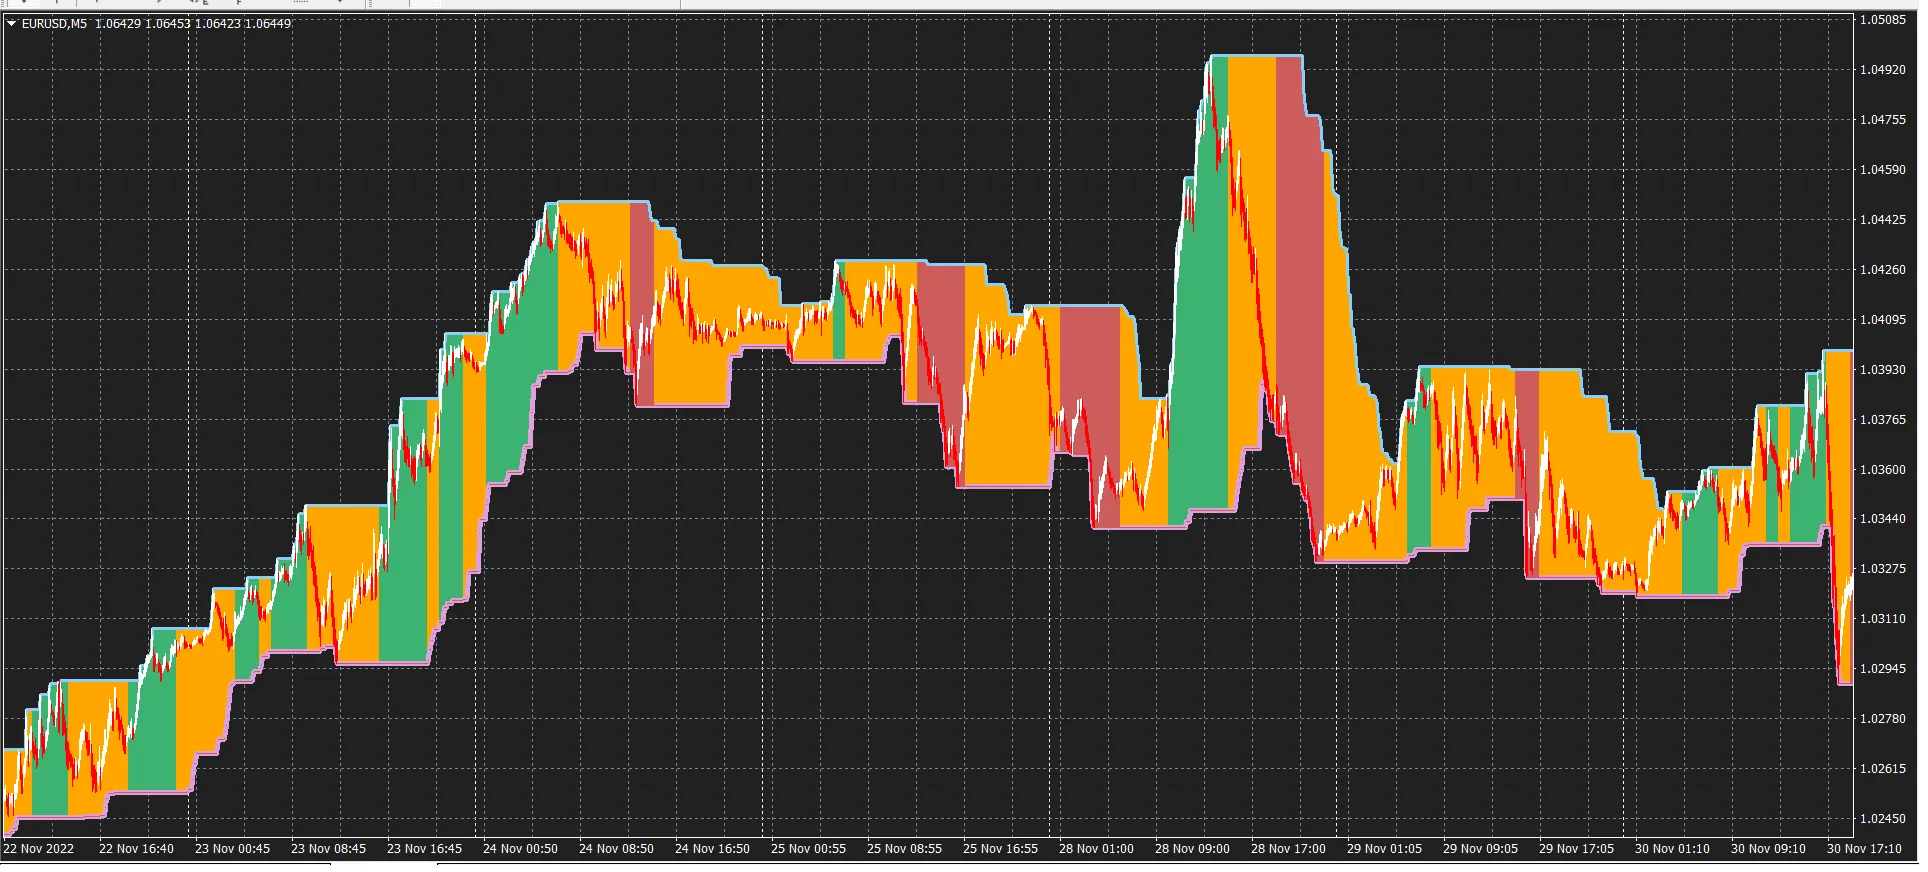
EASY TREND Color Indicators:
Green = Uptrend
Orange = Uncertain
Red = Downtrend
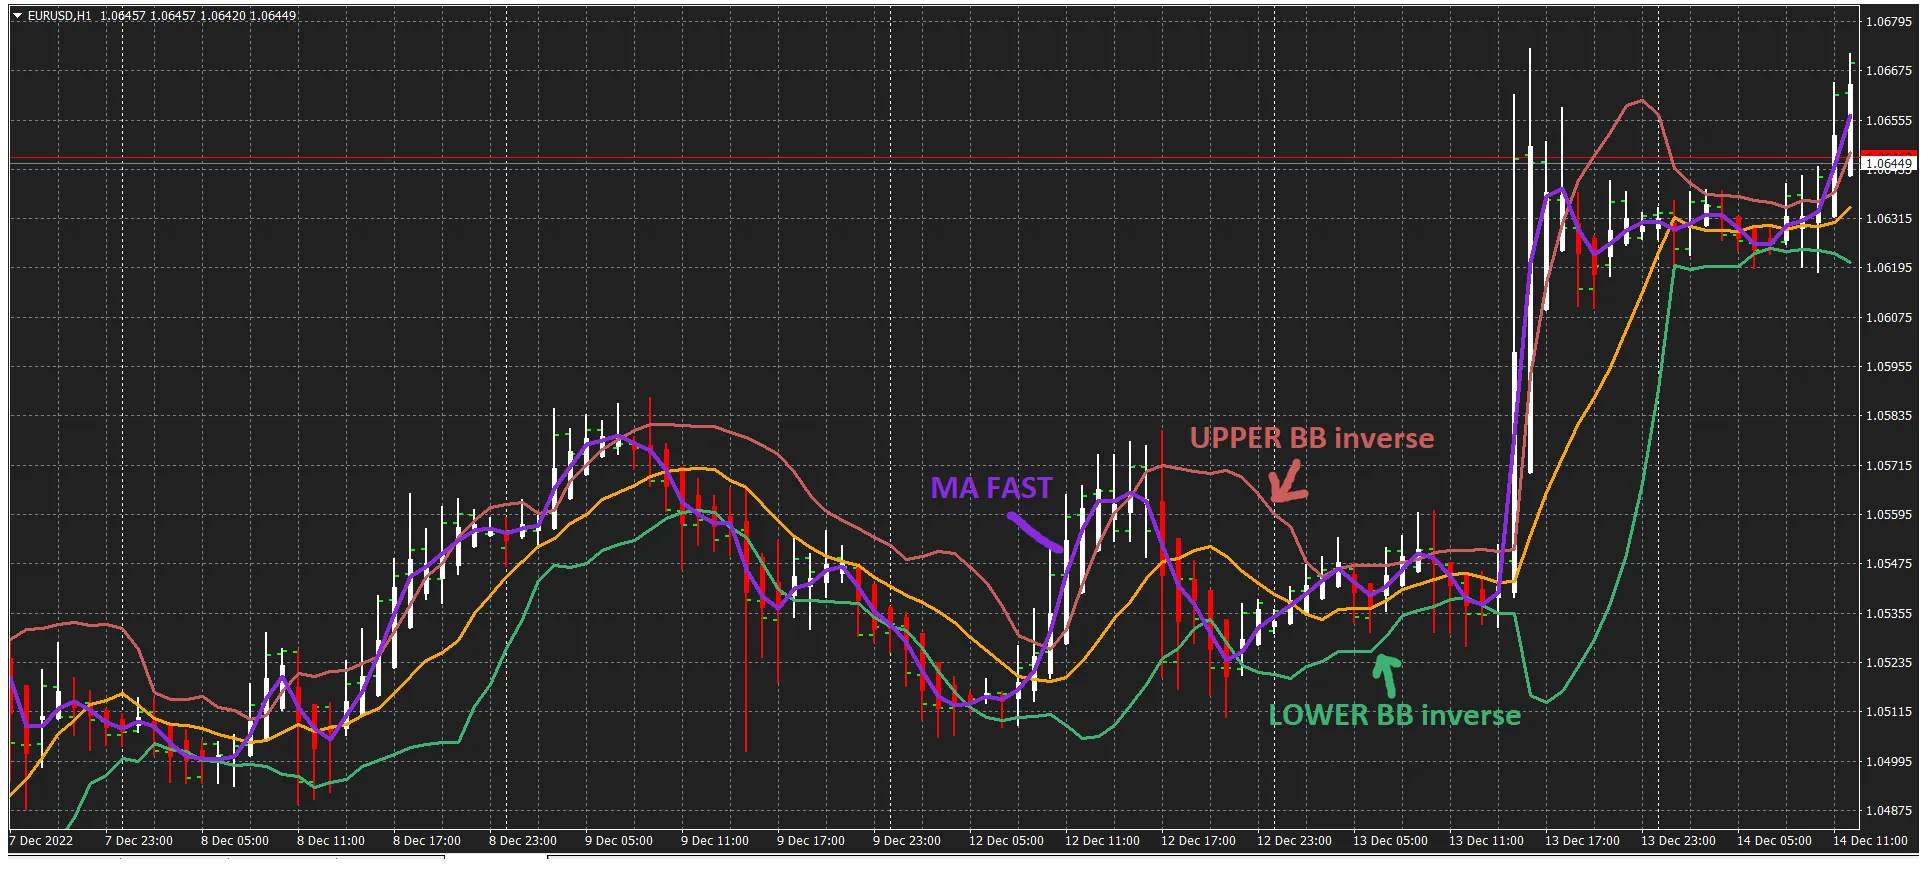
The Bollinger Inverse is essentially a Bollinger Bands indicator with adjusted parameters: a lower mode for the upper BB line and an upper mode for the lower BB. When a fast-moving average crosses above the upper BB, it suggests a potential uptrend, while crossing below the lower BB indicates a possible downtrend.
(Using Bollinger Inverse + Fast MA + Heiken Ashi)
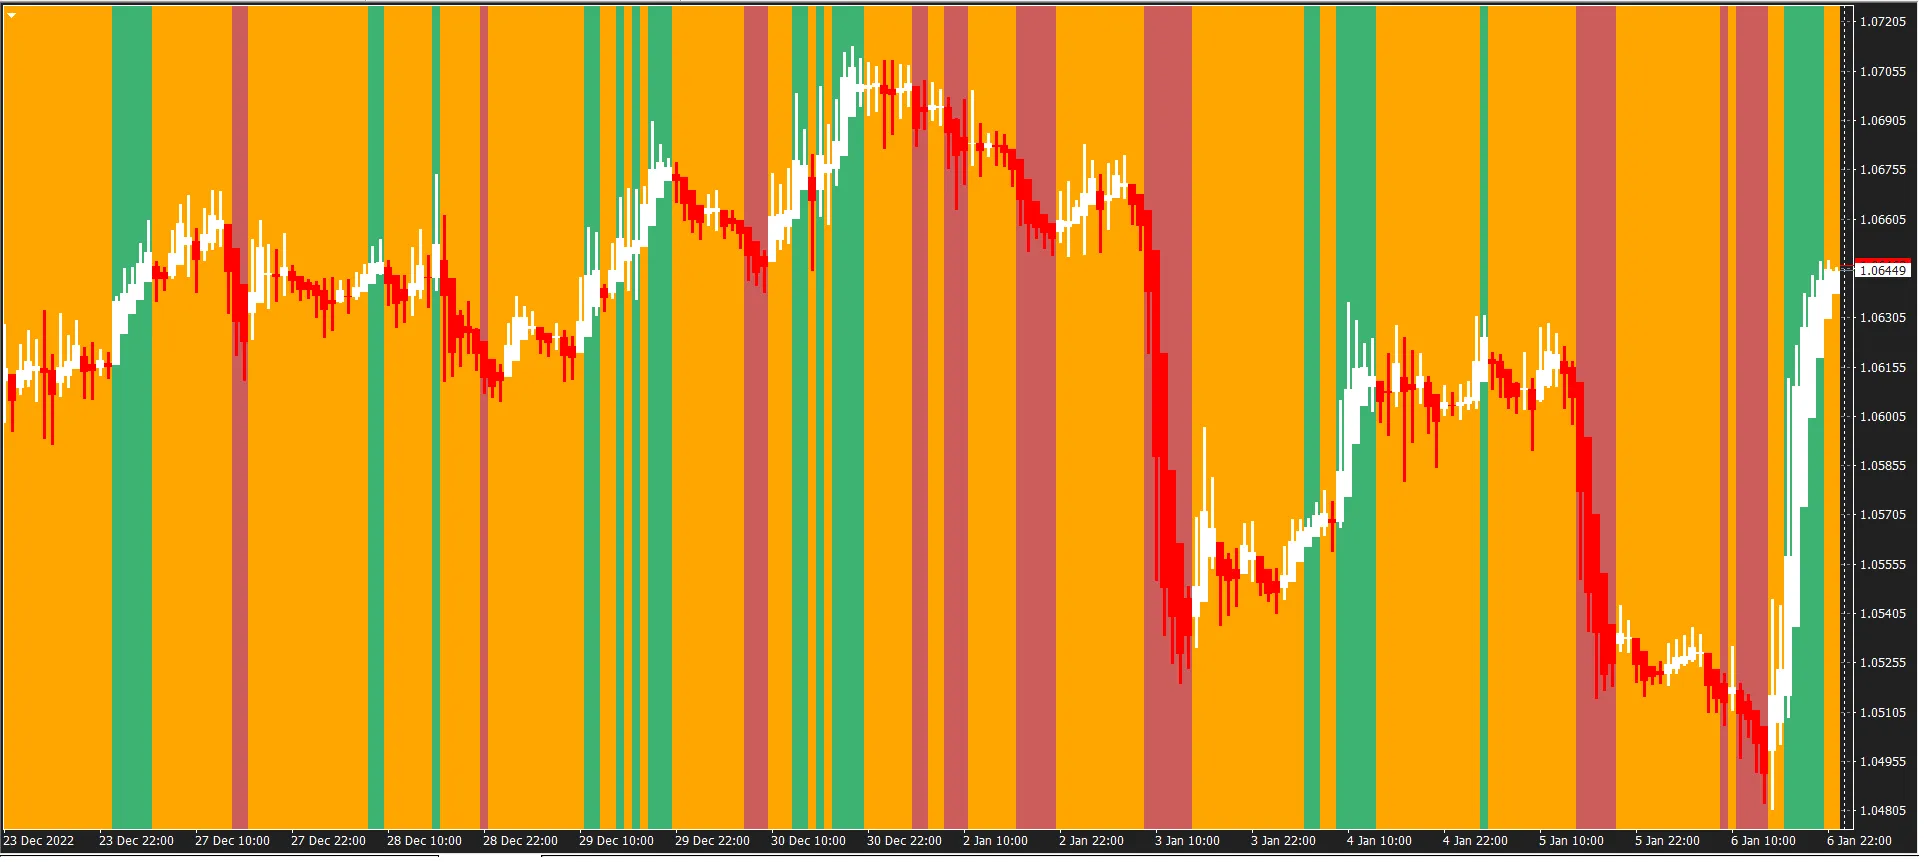
Again, I prefer to analyze trends using the H1 period, creating a colorful histogram, and employing MTF for better clarity on M1 or M5 periods. Here’s how to interpret the indicators:
- MA > UPPER BB → Green
- UPPER BB > MA > LOWER BB → Orange
- MA
I've also integrated the histogram into a MaxMinBand channel. Make sure to tweak the parameters for the Bollinger Inverse, including period, deviation, and shift, along with the fast MA settings and time frame.
I personally prefer the following settings:
extern int TimeFrame = 60;
// Input Parameters for Bollinger Inverse
extern int ainpperiod = 10;
extern double ainpdeviation = 1.25;
extern int ainpshift = 1;
// Input Parameters for Moving Average
extern int aperiodma = 3;
extern int ashiftma = 0;
extern int amethodma = 3;
extern int apricema = 5;
// Input Parameters for MaxMin Channel
extern int Band_PeriodMM = 90;
extern int ShiftMM = 1;
Feel free to share your preferred parameters with me!


Comments 0