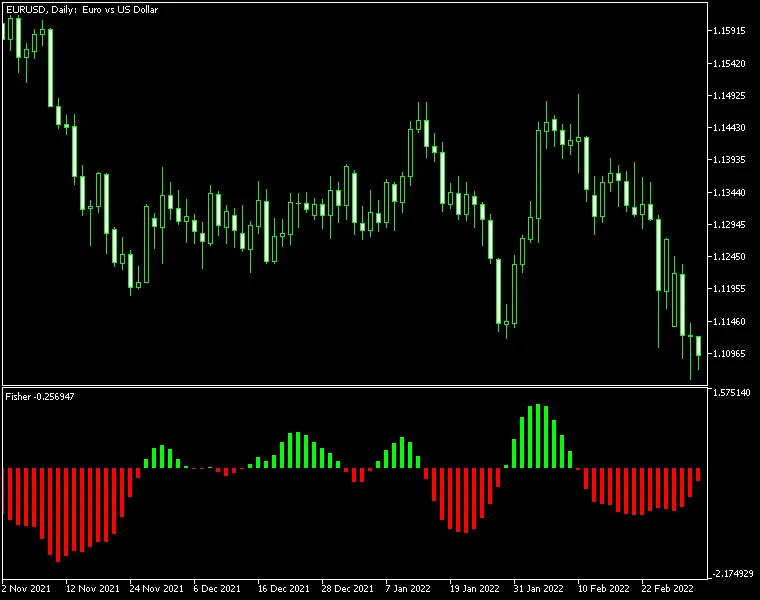
The Fisher Indicator is a straightforward histogram tool designed to help traders identify the direction and strength of market trends while also signaling potential trend reversals. Unlike many indicators you might find on MetaTrader 4 (MT4) or MetaTrader 5 (MT5), the Fisher Indicator operates independently of traditional indicators. Its calculations hinge on analyzing previous price extremes, utilizing some advanced mathematical techniques to relate current prices to these max/min values. It's available for both MT4 and MT5 platforms, but bear in mind that it’s a repainting indicator, meaning it recalibrates earlier bars as new data comes in.
Input Parameters
- Period (default = 10) — This setting adjusts the number of bars used to calculate the maximum and minimum values. A higher period will reduce the number of false trend signals but may also introduce some lag in responsiveness.


Comments 0