Theory:
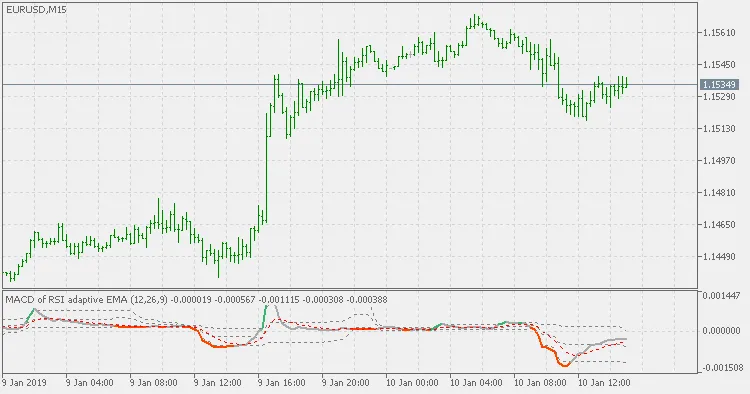
The MACD, or Moving Average Convergence Divergence, is traditionally calculated as the difference between two Exponential Moving Averages (EMAs)—a fast and a slow one. In this version, we’re using an RSI-adaptive EMA for our calculations. What sets this apart from the regular MACD is its incorporation of floating levels that indicate overbought and oversold conditions—something the standard MACD doesn’t do since it’s an unbounded indicator. You’ll have the flexibility to choose from four different color change options to help visualize these shifts:
- Color change based on MACD slope changes
- Color change when MACD crosses the signal line
- Slope changes when MACD crosses over the outer overbought/oversold levels
- Slope changes at the middle (floating zero) cross
Usage:
You can use this indicator just like any other MACD, making it a versatile tool in your trading arsenal.


Comments 0