The Parabolic SAR (Stop and Reverse) is a powerful technical indicator that traders use to analyze trending markets. Unlike a Moving Average, the Parabolic SAR operates with greater acceleration and can shift its position in relation to price movements. In a bullish market (Up Trend), the indicator sits below the price, while in a bearish market (Down Trend), it hovers above the price action.
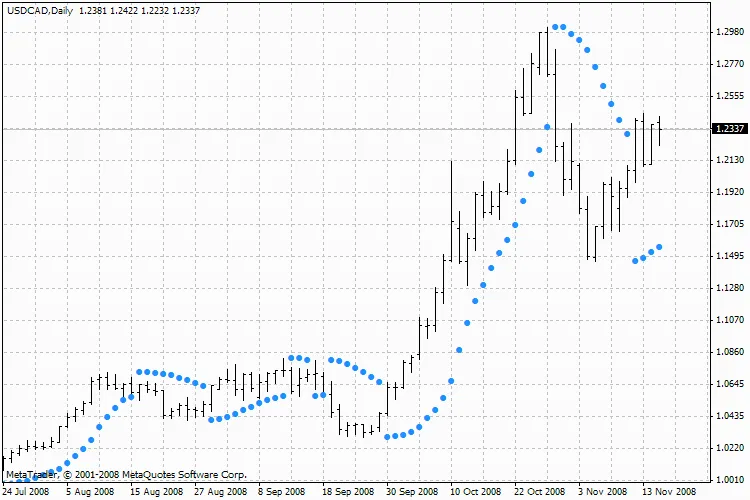
Parabolic SAR
When the price crosses the Parabolic SAR lines, the indicator flips its position, indicating a potential trend reversal. This shift often signifies either the end of a trend—leading to a correction or sideways movement—or a complete reversal. Traders should keep an eye on the previous period's high or low as a reference point during these changes.
The Parabolic SAR excels at highlighting exit points. For long positions, traders should consider closing their trades when the price dips below the SAR line. Conversely, for short positions, it's wise to exit when the price rises above the SAR line. Many traders also utilize the indicator as a trailing stop line.
When you're holding a long position (where the price is above the Parabolic SAR), the indicator line will continue to rise, regardless of minor price fluctuations. The amount of movement in the Parabolic SAR line is directly tied to the price action.
Calculating the Parabolic SARFor long positions, the formula is:
- SAR (i) = ACCELERATION * (HIGH (i - 1) - SAR (i - 1)) + SAR (i - 1)
For short positions, the calculation is as follows:
- SAR (i) = ACCELERATION * (LOW (i - 1) - SAR (i - 1)) - SAR (i - 1)
Where:
SAR (i - 1) = the value of the Parabolic SAR from the previous bar;
ACCELERATION = the acceleration factor;
HIGH (i - 1) = the high price for the previous period;
LOW (i - 1) = the low price for the previous period.
The indicator's value climbs if the current bar's price exceeds previous bullish highs, and vice versa. The acceleration factor doubles in such cases, causing the Parabolic SAR to converge on the price. This means that the faster the price moves, the more quickly the indicator tracks it.
Description of the Technical Indicator
You can find a comprehensive overview of the Parabolic SAR in the Technical analysis: Parabolic SAR section.


Comments 0