Understanding the Range Expansion Index (REI) for MT5 — If you're looking to step up your trading game, the Range Expansion Index (REI) is one tool you definitely want to add to your arsenal. This relative oscillator indicator, developed by the renowned Tom DeMark, is designed to measure the speed of price changes, signaling potential overbought or oversold conditions based on market strength or weakness. Tom dives deeper into this concept in his insightful book, The New Science of Technical Analysis.
The REI operates on a scale from -100 to +100, and it stands out as an advanced oscillator. What makes it unique is its ability to maintain composure during range trading, only flashing signals when significant peaks or troughs arise. Best of all, you can download this handy indicator for both MT4 and MT5 platforms.
Input Parameters
- REI_Period (default = 8) — This parameter sets the period for the indicator. If you want fewer but more precise signals, consider increasing this value. Conversely, reducing it will yield more signals, but they may be less accurate. It's advisable to stick with the default setting.
- EnableNativeAlerts (default = false) — Set this to true if you want MetaTrader to use its native pop-up alerts when the indicator crosses the 60 level from above or the -60 level from below.
- EnableEmailAlerts (default = false) — When set to true, this option triggers email alerts through MetaTrader when the indicator crosses the mentioned levels. Make sure your email settings are configured correctly in MetaTrader via Tools -> Options -> Email.
- EnablePushAlerts (default = false) — If you prefer push notifications to your device, switch this to true. Just ensure your notifications are set up in MetaTrader via Tools -> Options -> Notifications.
- TriggerCandle (default = Previous) — This setting allows you to choose which candle will trigger alerts: Previous indicates the most recently closed candle, while Current refers to the ongoing candle.
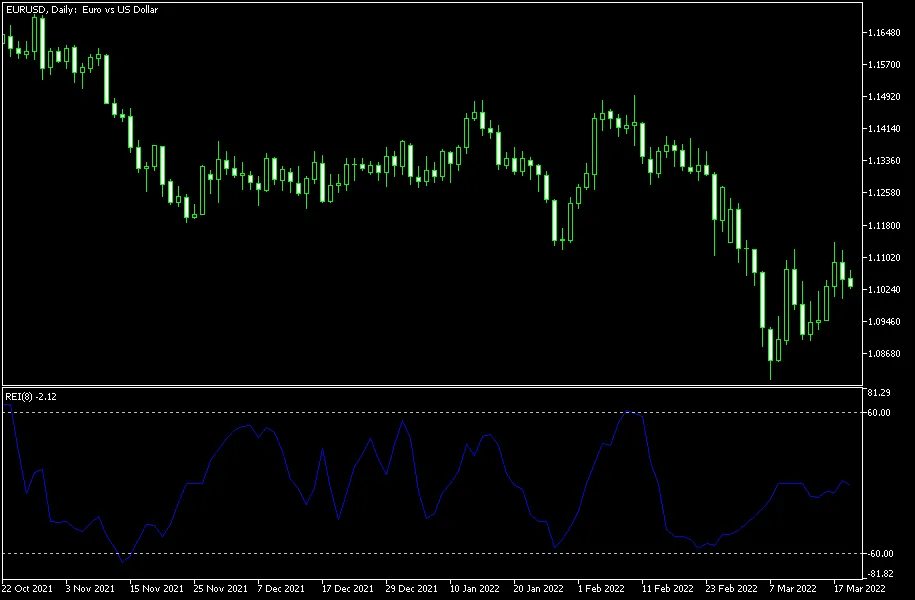
Tom DeMark recommends using the default period of 8. A bearish signal is triggered when the price moves above level 60 and subsequently falls below it. On the flip side, a bullish signal occurs when the price dips below level -60 and then climbs back above. While some traders find this indicator a bit hit-or-miss (like many oscillators), I’ve noticed it can be surprisingly effective on lower timeframes.


Comments 0