If you're looking to enhance your trading strategy, the SMA_Channel indicator for MetaTrader 4 is a great tool to consider. This indicator is built on a simple moving average (SMA) and plots a channel on your chart, providing you with valuable insights into market trends.
The SMA_Channel offers two plotting styles that you can choose from in the settings:
- Plot Style 1: Displays the channel as a line.
- Plot Style 2: Shows the channel as bars.
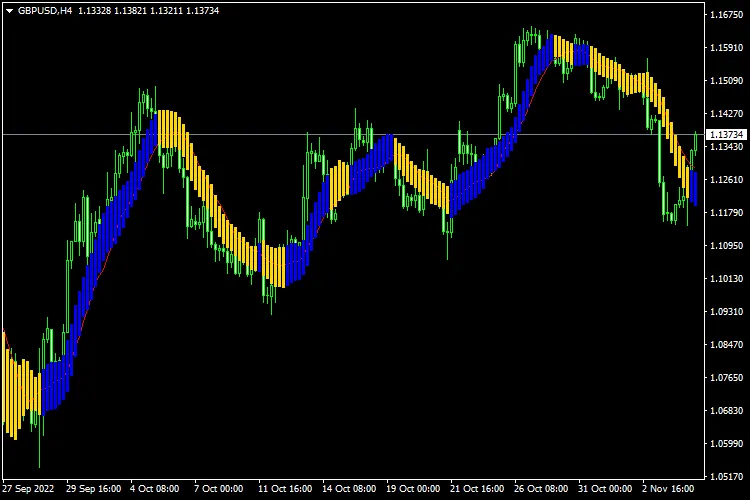
Here’s a quick example:
- When you see blue bars below the candles, it indicates an uptrend.
- If you spot gold bars above the candles, that signals a downtrend.
Another way to interpret the SMA_Channel is by looking at the colored lines:
- If the blue line is above the gold line, you’re looking at an uptrend.
- Conversely, if the gold line is above the blue line, that points to a downtrend.

Incorporating the SMA_Channel indicator into your trading toolkit can give you an edge in identifying market trends. Happy trading!


Comments 0