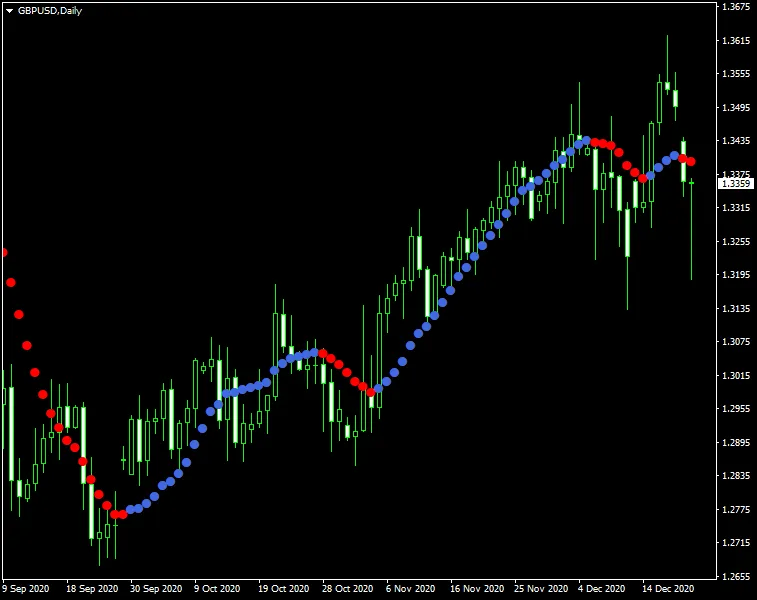
Dots Indicator for MetaTrader 4 is a fantastic tool that helps traders identify the current trend direction with ease. Based on a 2006 creation by TrendLaboratory, this indicator places colored dots right on your main chart. Blue dots indicate a bullish trend, while red dots signal a bearish trend.
What sets this indicator apart is that it doesn't depend on any standard MetaTrader indicators. Instead, it employs a call to iMA() (moving average) to derive price values based on the input price type (Close, Open, High, Low, Typical, etc.). The calculation hinges on the cosine of the price change angle, making it a unique choice for traders.
Input Parameters
- Length (default = 10) — This defines the period of the indicator. A higher value means more lagging but fewer false signals.
- AppliedPrice (default = PRICE_CLOSE) — Choose the price type to use in your calculations.
- Filter (default = 0) — This nifty parameter helps filter out spikes without introducing lag.
- Deviation (default = 0) — Adjusts the vertical display of the indicator.
- Shift (default = 0) — Moves the indicator display horizontally.
For optimal results, a solid strategy is to wait for two dots of the same color before entering a trade in the direction of the trend. However, be cautious as there are times when this method might not perform as expected. A better approach could be to utilize a single dot signal with the Filter parameter set to something like three times the currency pair's spread.


Comments 0