Welcome back, fellow traders! Today, we're diving into the exciting world of Volume Spread Analysis (VSA) and how it can enhance your trading strategy on MetaTrader 4.
Understanding VSA:
VSA is all about reading the market's pulse and mapping it out, giving you a clearer picture of potential future movements. It’s like having a trading compass that helps you navigate through the market’s twists and turns.
Decoding the Bars:
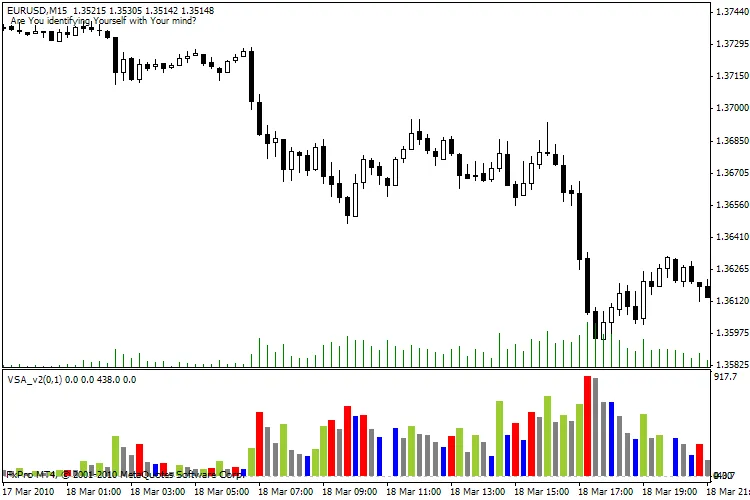
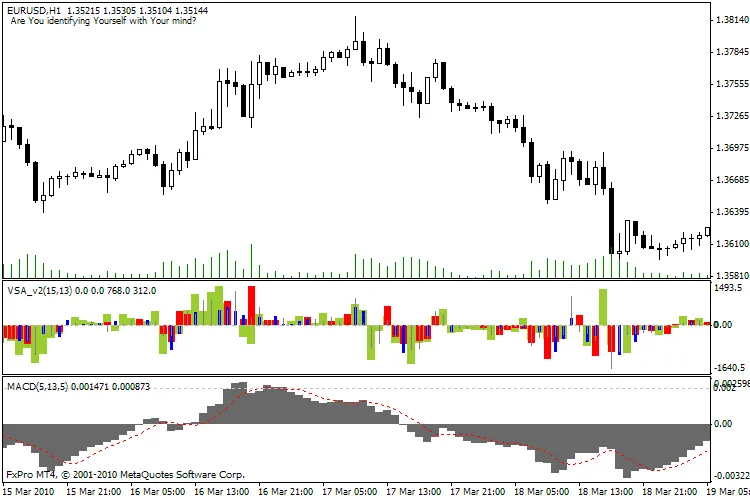
- YellowGreen: This combination suggests an increasing spread and rising volume—indicating strong participation. If you see this, you can expect the price to continue moving in this direction.
- Red: Here, we have a decreasing spread alongside increasing volume. This signals that the upward movement might be losing steam, so keep your eyes peeled!
- Blue: An increasing spread with decreasing volume means the price is shifting without strong market participation. It's a sign to be cautious.
- Gray: This indicates a decreasing spread and volume—essentially, a waiting market. It’s a sign of a dull or congested market, so patience is key.
Using MACD with VSA:
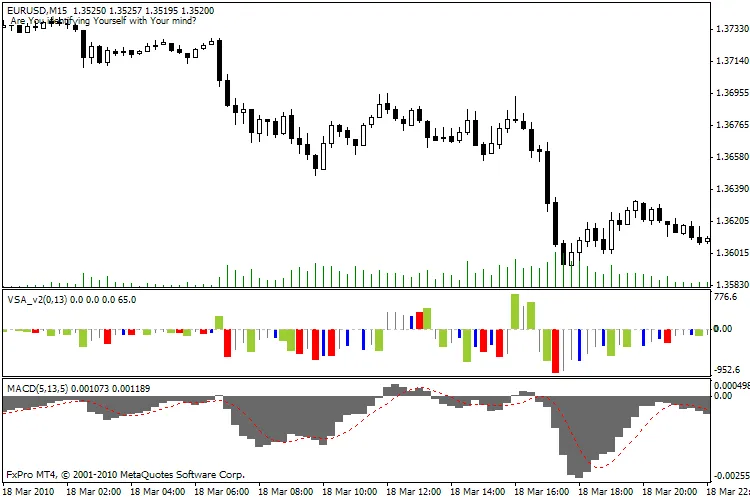
Now, let’s talk about Multi-Time Frame (MTF) settings. For optimal results, try using VSA on a 15-minute chart while analyzing the H1 chart. Essentially, one H1 bar will encapsulate four 15-minute bars, giving you a more granular view of market movements.
Happy trading, and as always, if you have any questions or need further clarification, don’t hesitate to reach out! :)


Comments 0