Understanding the Zigzag2 R Indicator
If you’ve been trading for a while, you know how crucial it is to visualize price movements effectively. The Zigzag.mq4 indicator traditionally uses the DRAW_SECTION style, which limits you to drawing lines only between points on different bars. But with the Zigzag2 R indicator, you can say goodbye to those constraints!
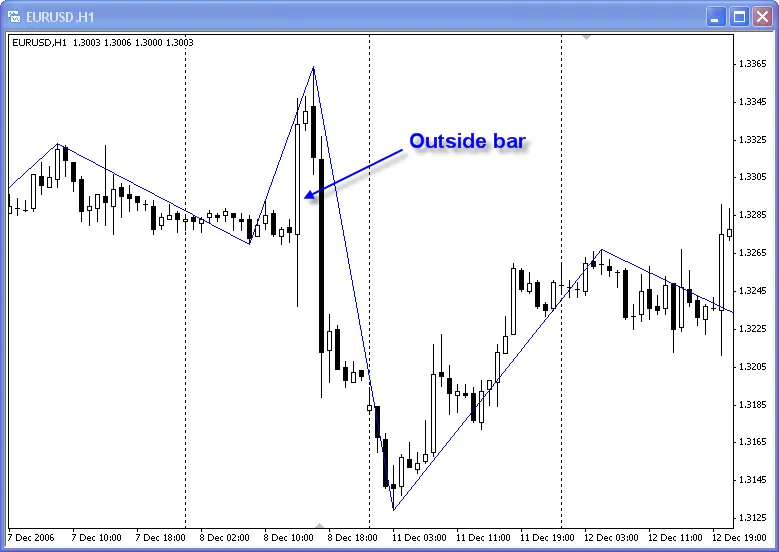
This new style employs two buffers instead of one, unlocking the potential for a more dynamic representation of the price action. The Zigzag2_R_.mql4 indicator is a great example of this. It even processes outside bars: if the current bar's high is greater than the previous bar's high and its low is less than the previous bar's low, it updates the visualization accordingly. Plus, the color of the lines is determined by the first of the two bars in the sequence.
#property indicator_chart_window#property indicator_buffers 2#property indicator_color1 Blue#property indicator_color2 Red
To integrate the Zigzag2 R indicator into your MQL4 programs, you’ll need to use the following constructions:
iCustom(NULL, 0, "Zigzag2_R_", 12, 5, 3, 0, index) - for peaks
iCustom(NULL, 0, "Zigzag2_R_", 12, 5, 3, 1, index) - for bottoms
As for the block that processes the outside bar, this is just a sample. Feel free to customize it with your own algorithm to suit your trading strategy!


Comments 0