Hey fellow traders! If you're looking to refine your trading strategies and gain some hands-on experience, let me introduce you to the TPEHEP Indicator for MetaTrader 4. It's a fantastic tool that helps analyze historical data and understand market dynamics.
The TPEHEP, or Trainer, is designed to assist traders—especially newbies—in analyzing interesting strategies while practicing their skills on historical data. It’s all about getting a clear grasp of how order triggering works and the logic behind strategy signals. You can find more about the market rules here.
Initially, this assistant was created to pinpoint key decision-making moments. It highlights the opening of BUY (represented by a blue line, key "B") or SELL (shown in pink, key "S") orders, as well as the closing lines. The chosen keys make it easy to navigate—your right hand handles the history while your left executes commands.
Basic Operation Rules:
- Open and close orders only when the candle is closing (Close[Bar0]) within a vertical colored area (purple). The actual order is executed as soon as the new candle opens (Open[Bar-1]).
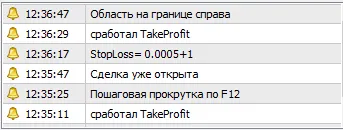
- When StopLoss or TakeProfit levels are hit, the order closes at the active price. You can also move StopLoss or TakeProfit using your mouse while maintaining minimal distance and freezing settings.
As you get started, you can shift the active area using the "<" and ">" keys, gradually moving toward the right side of the chart. To offset the history, press "F12" or your designated hot key, and the active zone (purple) will remain in place.
If you want to set a custom hot key instead of using "F12", simply press your desired key, and if it’s incorrect, an alert will pop up saying, "Pressed wrong button ХХХ." You can then input your preferred key in the settings under "Key to shift the chart by 1 step." The default is the "Del" key on the numeric keypad.
Setting up the indicator is a breeze: just open your currency pair chart, choose the history, apply your analyzed strategy template, and attach the TPEHEP indicator. Don’t forget to save your settings by pressing the "Р" key (Record) as a template (e.g., EURUSD.60.tpl). If the active area doesn’t show up, a quick click of the left mouse button will do the trick!
Once you plot the chart, it should look something like this:
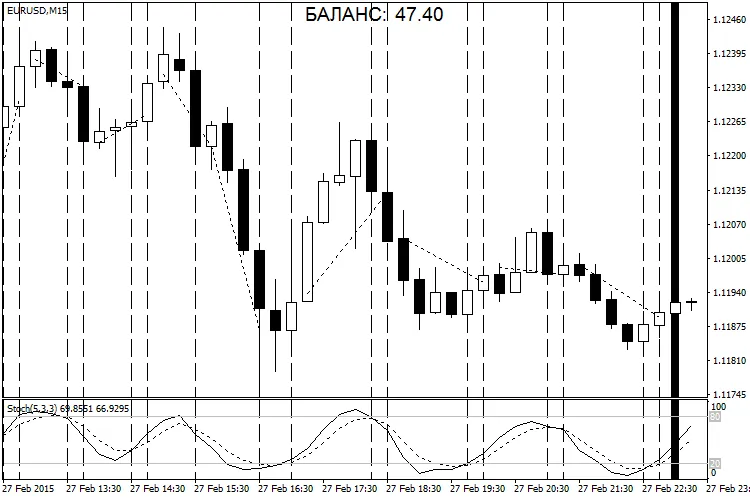
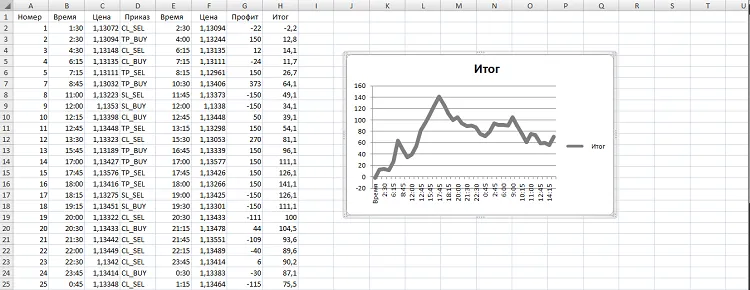
The TPEHEP Indicator has also evolved to support managing open positions, monitoring trader errors, and generating final data outputs, including Excel tables and profitability charts.
The results from your strategy testing will be displayed in the BALANCE table. Once you finish checking, press the "Р" (Record) key, and your results will be saved to a file like "EURUSD.60 2015.07.06-2015.07.06.xls" located in the <terminal_data>\MQL4\Files\ folder.
After this, feel free to explore different strategies!
Analyzing the Triple Screen Strategies
When you want to plot on another timeframe, make sure to disable order processing (set Trading=false). This will leave you with just the vertical lines signaling key moments. To save your plotting results, press the "Р" (Record) key, and they’ll be stored in the "EURUSD.60 2015.07.06-2015.07.06.tpl" file. You can then use this template on a different timeframe and perform final profitability tests with order processing enabled (set Trading=true).
Once you've tested your strategy, back up your recorded files in a folder named something like Test EURUSD Per Stochastic 5 3 3 Moving Averages EMA55. This way, you can easily identify optimal strategy setups. Just keep in mind that if the template names or results match during your next testing, the new files will overwrite the old ones, so regular backups are crucial!


Comments 0