Hey fellow traders! Today, let's dive into the FiboPiv_Daily_DK indicator and how it can enhance your trading strategy.
First off, this indicator is a fantastic tool for gauging market sentiment. It helps you identify key pivot points that can signal potential buy or sell zones.
How to Use FiboPiv_Daily_DK
- Above Pivot = BUY AREA: If the price is hovering above the pivot point, it indicates a bullish market. This might be your green light to enter a buy position.
- Below Pivot = SELL AREA: Conversely, if the price dips below the pivot point, you’re looking at a bearish sentiment, which could signal a good time to sell.
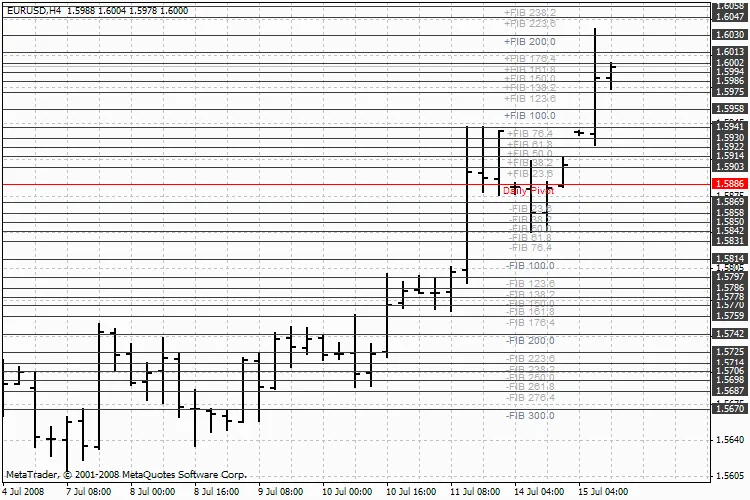
FiboPiv_Daily_DK Indicator
Remember, while the FiboPiv_Daily_DK indicator is a valuable asset in your trading toolbox, it’s always wise to combine it with other analysis methods for the best results. Happy trading!


Comments 0