If you're looking to sharpen your trading strategy, let me introduce you to Fractal Bands. This indicator is designed to enhance the traditional Bollinger Bands by adjusting their width, which helps in reducing the chances of false entry or exit signals. It’s based on a model of price variation using Fractional Brownian Motion, making it a sophisticated tool in your trading arsenal.
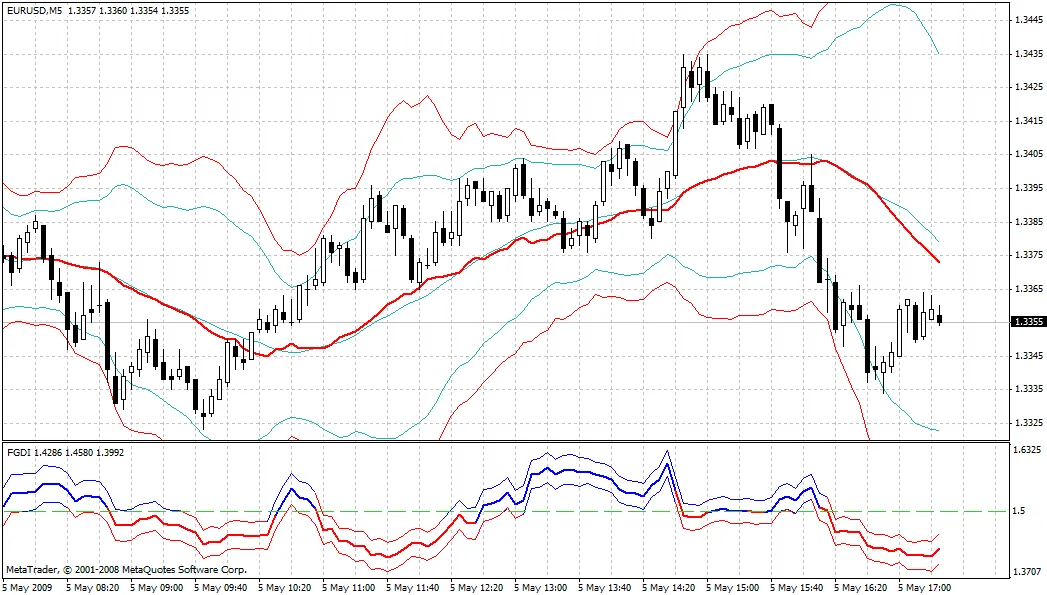
To give you a clearer picture, here’s a snapshot of how the Fractal Bands look when the speed of the FRASMA is set to 30. In the chart, you’ll notice the red line represents the Fractal Bands, while the blue line shows the standard Bollinger Bands, also set to a speed of 30. Below that, you’ll find the Fractal Graph dimension, which can help you visualize the data even better:
For a deeper dive into how Fractal Bands can enhance your trading strategy, feel free to check out the detailed breakdown on my blog. Understanding these tools can give you an edge in the market!


Comments 0