Hey fellow traders! Today, we're diving into the world of the Geometric Moving Average (GMA) and how it can enhance your trading strategy on MetaTrader 5.
So, what exactly is the geometric mean? In simple terms, it's a type of average that helps us find the central tendency of a set of numbers by multiplying their values together, rather than adding them up like the arithmetic mean. This can be particularly handy when dealing with values that are meant to be multiplied or that grow exponentially over time.
For instance, think about measuring growth rates—like the human population or the interest rates on your investments. The GMA shines in situations where you're looking at proportional growth or comparing different rates. It's especially useful for calculating speeds and ratios, as it gives a more accurate picture of performance. For example, if you average a rate of 0.5x (half speed) and 2x (double speed), the arithmetic mean might lead you to think there's no net change. However, the geometric mean gives you a clearer view of growth.
The GMA is also closely tied to what's known as the Compound Annual Growth Rate (CAGR), which is a fancy term for the average rate at which an investment grows over a period of time. This is particularly useful for traders looking to understand how their assets are performing over the long haul.
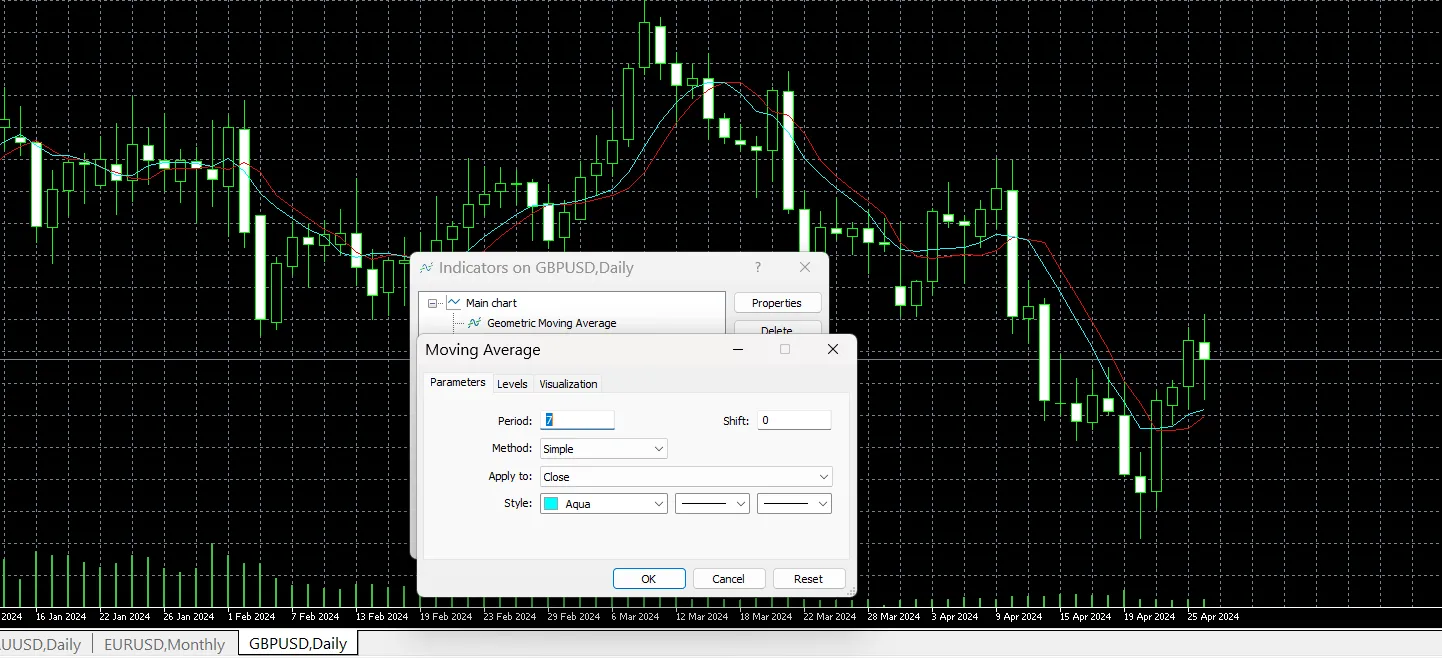
Check out these images below to see how the Geometric Moving Average looks in action:

Whether you're a seasoned trader or just starting out, understanding the GMA can give you an edge in the markets. So, keep it in your toolkit as you navigate your trading journey!


Comments 0