If you're diving into the world of trading, you might've come across Holt's double exponential smoothing. But have you ever wondered about the trend component it offers? In this post, we’ll explore the trend-focused version of this indicator that’s a game-changer for traders.
Typically, Holt's double exponential smoothing is used as an on-chart average indicator, complete with a forecasting element. However, this specific version strips away the noise and focuses solely on the trend component, giving us a clearer view of market dynamics.
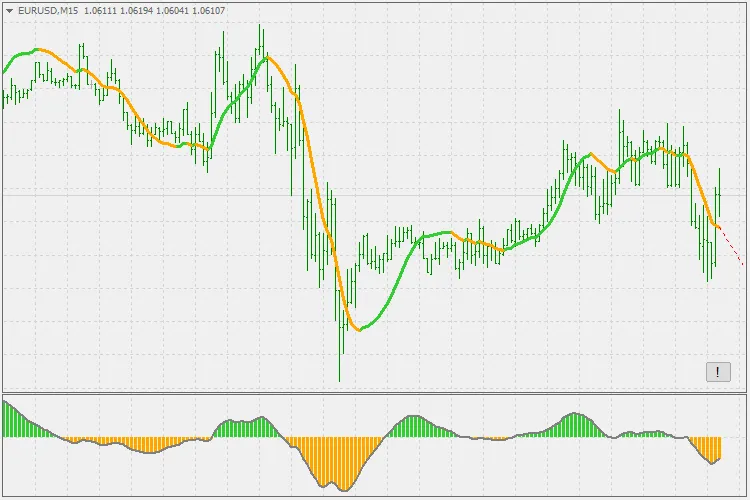
As you can see from the chart, this oscillator can be incredibly useful. With a bit of experimentation, it can perform just as well as other trend-seeking indicators.
In the example provided, I've included the standard Holt's double exponential smoothing indicator for comparison. Notice how the trend here is distinct from the slope of the on-chart Holt's values? They are not the same and should be treated differently. Even their slopes diverge.
For this reason, the trend version should be applied with its own set of rules—think more along the lines of MACD rules, but without the signal line. That said, using both indicators on the same chart can provide robust confirmation for your trading decisions, depending on which one you choose as your primary tool. Additionally, the trend version can offer valuable insights into the forecasting aspect of the on-chart version.
Don’t forget, this version also comes equipped with alerts that trigger when there’s a cross of the zero line, making it even more trader-friendly.


Comments 0