Hey fellow traders! Today, we're diving into a powerful tool that can help you refine your trading strategy: the Keltner ATR Bands.
The Keltner Bands are a channel indicator that can give you insight into market volatility and price action. But what exactly are they, and how can they benefit you? Let's break it down.
What Are Keltner ATR Bands?
Keltner ATR Bands are a volatility-based indicator that consist of a central moving average and two outer bands. The distance between these bands is determined by the Average True Range (ATR), which adjusts the bands according to market volatility.
How to Use Keltner ATR Bands in Your Trading
- Identify Trends: When the price is consistently above the upper band, it’s a strong bullish signal. Conversely, if it’s below the lower band, you might be looking at a bearish trend.
- Spot Potential Reversals: When price touches or exceeds the outer bands, it could be an indication that the market is overbought or oversold, presenting potential reversal opportunities.
- Combine with Other Indicators: For best results, consider using Keltner Bands alongside other indicators like RSI or MACD to confirm signals.
Visualizing Keltner ATR Bands
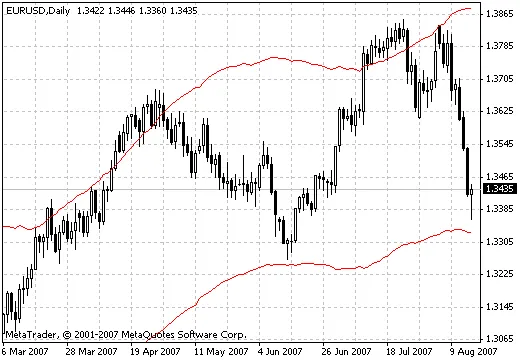
In the chart above, you can see how the Keltner ATR Bands adapt to price movements, providing a visual representation of volatility.
So there you have it! Keltner ATR Bands can be a crucial part of your trading toolkit. Give them a try and see how they fit into your strategy. Happy trading!


Comments 0