Hey there, fellow traders! Today, we’re diving into the fascinating world of the MACD Divergence indicator. If you’re looking to sharpen your trading skills, this tool can be a game-changer.
The MACD, or Moving Average Convergence Divergence, is a popular momentum indicator that helps traders identify potential buy and sell signals. Divergence occurs when the price of an asset moves in the opposite direction of the MACD indicator, which can indicate a potential reversal in the market.
What is MACD Divergence?
In simple terms, MACD divergence happens when the momentum of price movements doesn’t align with the price itself. Here’s a quick rundown:
- Bullish Divergence: This occurs when the price hits a lower low, but the MACD forms a higher low. This may suggest that a reversal to the upside could happen.
- Bearish Divergence: This is the opposite scenario, where the price makes a higher high while the MACD shows a lower high, hinting that a downward reversal could be on the horizon.
Now, let’s take a look at the indicator in action:
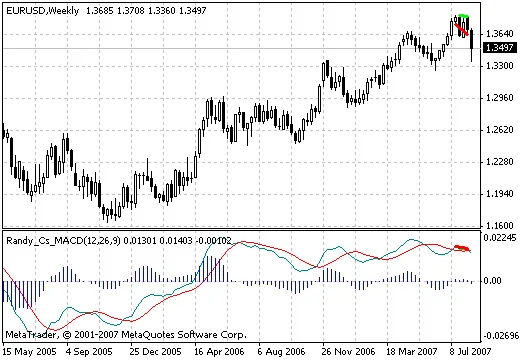
As you can see from the chart, identifying these divergences can provide valuable insights into potential market movements. Incorporating MACD divergence into your trading strategy can help you make more informed decisions.
So, next time you’re analyzing charts, keep an eye out for MACD divergences. They might just give you the edge you need to enhance your trading performance!


Comments 0