Hey fellow traders! Today, let's dive into the Moving Average Bands Width (MABW) and how it can be a game-changer in your trading strategy.
According to Vitali Apirine, the brains behind this concept, the width of the moving average bands serves as a reliable gauge of market volatility.
Vitali Apirine:
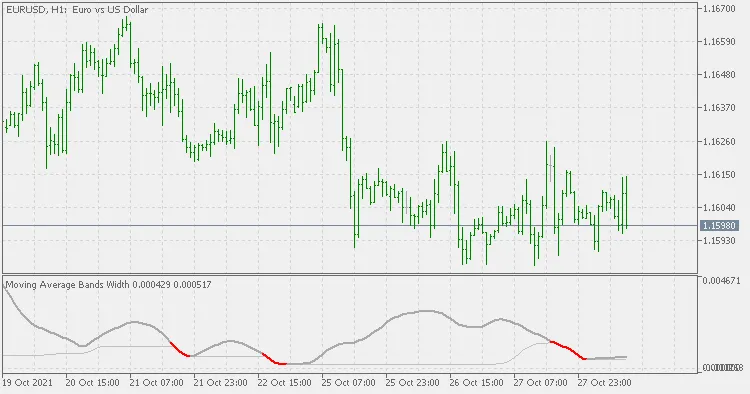
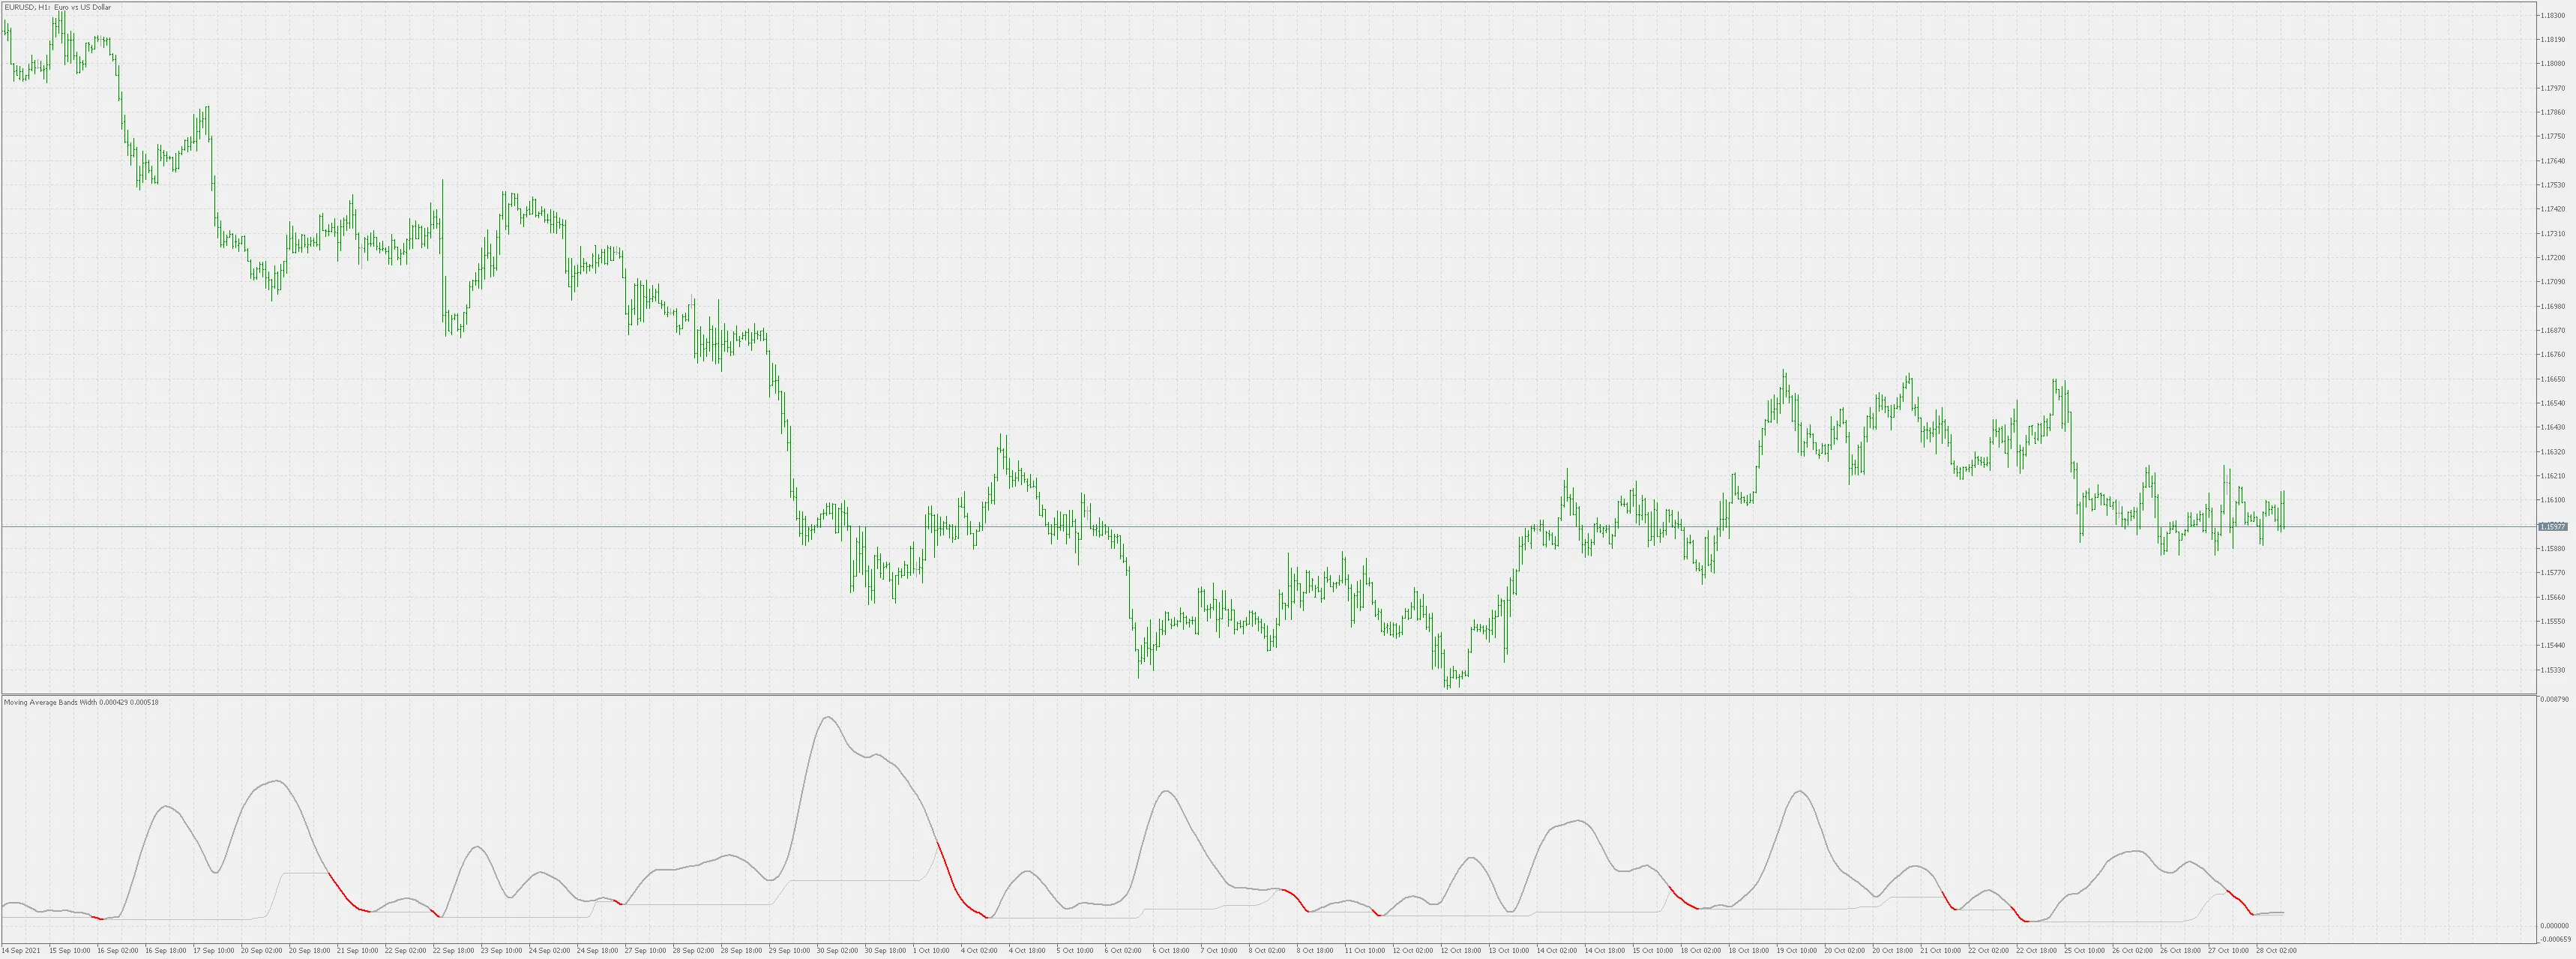
As market volatility ramps up, you’ll notice that the distance between the bands widens. Conversely, as volatility eases, the bands will draw closer together. The MABW quantifies this percentage difference between the bands, and keep an eye on how changes in this difference can signal potential price moves or shifts in trend.
In this latest version, the only tweak from the original published in TASC's August 2021 issue is that we've highlighted periods in red when the bands reach extreme lows. This could hint at an expansion phase after a period of tight consolidation.
Here are some key takeaways:
- This is not a directional indicator—it primarily indicates volatility.
- You can use it to spot potential trend reversals (especially after hitting those lower extremes) or to confirm trend continuation following a period of consolidation.
Happy trading, and may the charts be ever in your favor!


Comments 0