Hey fellow traders! Today, I want to dive into the MUV method described by Sator, which I believe has a lot of potential for our trading strategies.
The MUV% indicator is a handy tool that calculates the current position between the maximum and minimum values over a specified period, known as the KPeriod. It’s great because you can utilize both the difference between the current and previous MUV values, as well as the MUV value itself.
Here are the key parameters you’ll want to set:
- MAPeriod = 14; this defines the period for the MUV indicator;
- MUV KPeriod = 14; this sets the calculation period for the minimum and maximum values;
- ShowDif = true; this option allows you to visualize the indicator based on the difference;
- ShowMUV = true; this lets you see the indicator based on its value;
The MUV_Diff indicator simply showcases the difference in MUV values, making it easier to spot trends.
For this indicator, you’ll only need to set:
MAPeriod = 14; again, this is the period for the MUV indicator.
Both indicators make use of SMA and EMA, which are essential for smoothing out the data and helping us make better trading decisions.
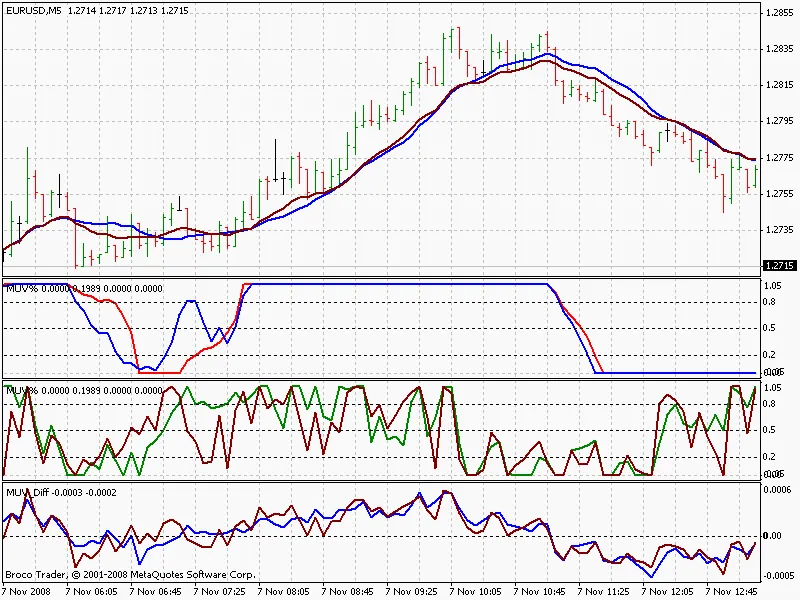
In the chart above, you’ll see the MUV represented using both the 0 and 1 methods. Next, we have the MUV% with the ShowDif option disabled, followed by the MUV% with the ShowMUV option turned off. Finally, you’ll notice the MUV_Diff, which highlights the differences in MUV values.
Happy trading, and don’t hesitate to share your thoughts or questions about using MUV indicators in your own strategies!


Comments 0