Hey fellow traders! Today, we’re diving into a powerful tool that can give you an edge in your trading strategy: the OsMA Divergence indicator. If you’re looking to refine your trading skills, you’ll want to pay attention!
The OsMA indicator, which stands for Oscillator of Moving Average, helps identify momentum shifts in the market. When paired with its divergence signals, it can be a game changer. Check out the colored OsMA below that showcases these divergences:
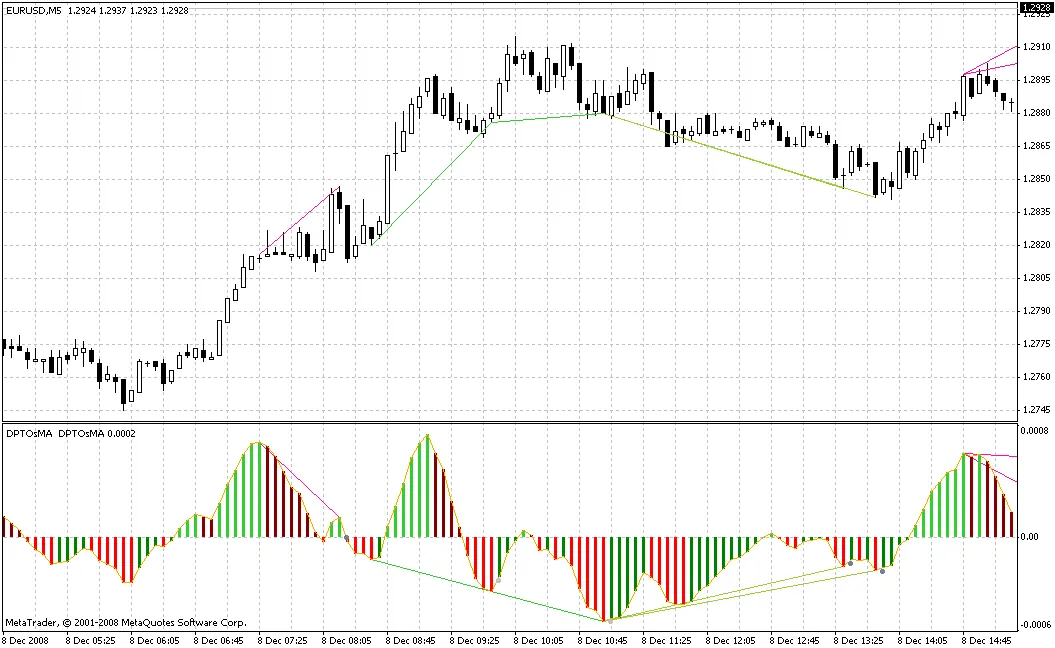
Colored OsMA and OsMA showing divergences.
To get started with the OsMA Divergence, you'll want to open the ind_OsMAColored_v1 indicator. Then, simply drag the OsMA_Divergence_v1 indicator into the same chart window using your mouse. This setup will allow you to visualize the significant gray points that indicate divergence.
From my experience, this method works best on the 5-minute charts. However, keep in mind that during strong trends, the rollback signals may not be as pronounced, so it’s wise to take those divergence factors with a grain of salt.
If you’re interested in automating your trading using this indicator, I have an Expert Advisor (EA) available. Feel free to drop me a private message or send me an email for more details!


Comments 0