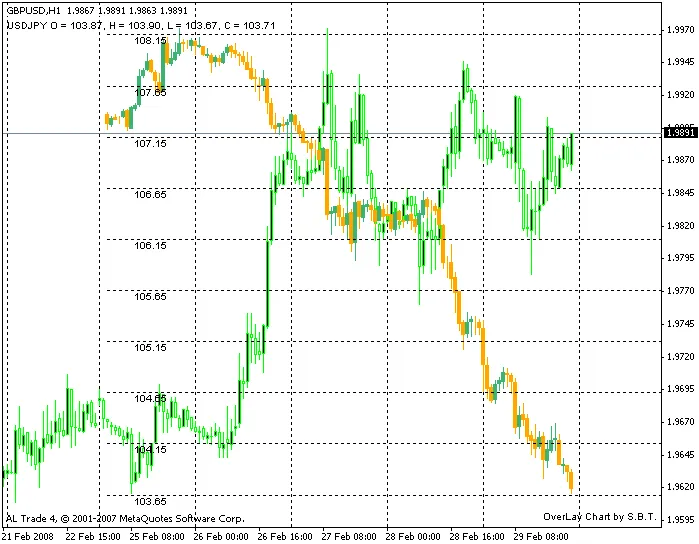
What is an OverLay Chart?
As traders, we often seek out tools that enhance our analysis and decision-making. One such tool is the OverLay Chart. This chart type allows you to compare multiple data series on a single chart, giving you a clearer picture of market trends.
Why Use OverLay Charts?
- Visual Comparison: Easily spot correlations between different assets.
- Trend Analysis: Identify potential trading opportunities based on overlapping trends.
- Efficiency: Save time by seeing all relevant information in one view.
How to Get Started with OverLay Charts
To use OverLay Charts effectively, follow these steps:
- Select the assets you want to compare.
- Adjust the time frame to suit your trading strategy.
- Analyze the overlaps and divergences for potential signals.
Conclusion
Incorporating OverLay Charts into your trading toolkit can provide valuable insights. Whether you're looking to compare currency pairs or other financial instruments, this method can streamline your analysis. Give it a try and see how it can enhance your trading game!


Comments 0