When it comes to charting methods, Renko charts stand out for their unique approach. The name 'Renko' actually comes from the Japanese word 'renga,' meaning bricks. Just like their name suggests, Renko charts are constructed using bricks that only appear when prices move by a certain amount, known as the box size.
For instance, if you're using a 5-unit Renko chart, a 20-point price increase will be represented by four bricks, each 5 units tall. This method creates a clean visual representation that makes it easier to spot trends without the noise of minor price fluctuations.
Renko charts were introduced to traders in the US by Steven Nison through his insightful book, Beyond Candlesticks. Since then, they’ve gained popularity among traders looking for effective trend analysis tools.
Identifying Trends with Renko Charts
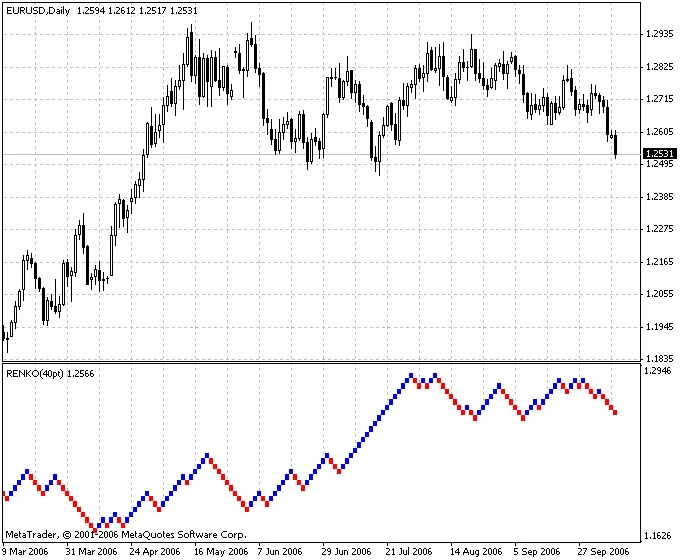
One of the most appealing aspects of Renko charts is their ability to signal trend reversals. A new blue brick indicates the start of an uptrend, while a red brick suggests a downtrend. However, keep in mind that, like any trend-following technique, Renko charts can occasionally produce whipsaws—false signals that appear at the tail end of fleeting trends. Nonetheless, the goal with this method is to capture the bulk of significant price movements.
Renko charts excel at isolating underlying price trends, which can be particularly useful for pinpointing support and resistance levels. By filtering out the minor fluctuations, they help traders focus on the bigger picture.
Parameters to Consider
- Box Size: This parameter determines how much price movement is needed to create a new brick.


Comments 0