The Theory Behind Stochastic Volatility
This indicator is based on the groundbreaking work of Francesco G. Cavasino, as detailed in his article on "Stochastic Volatility." It's designed to give traders insight into market volatility.
- Original Stochastic: This input variable in the code (or the option labeled Calculate using original stochastic in the inputs tab) allows you to choose whether you want the indicator to calculate the smoothness of the stochastic in the traditional George Lane method or as an Exponential Moving Average (EMA). By default, this is set to true.
- Original Volatility: Similarly, this input (or the option Calculate using original volatility) is based on the original indicator's assumption that historical volatility is calculated on daily data, with the year consisting of 252 trading days. If you're using this indicator on a timeframe other than daily, it's wise to turn off the original volatility calculation (set this parameter to false).
How to Use the Indicator:
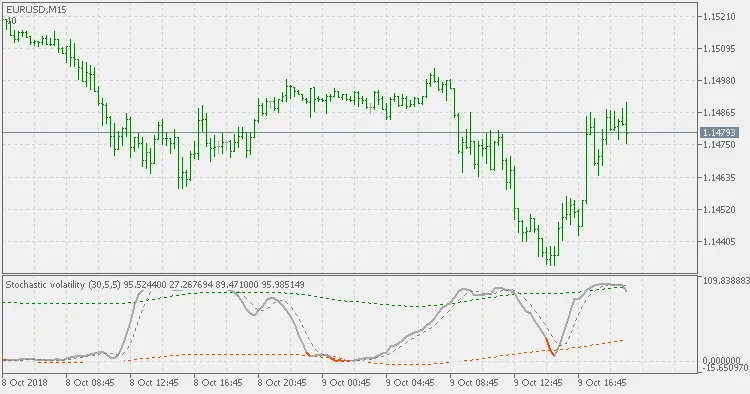
Keep in Mind: This isn't a directional indicator. Even though it's stochastic in nature, it doesn't indicate the market's direction; instead, it reveals the size and amount of volatility. The theory behind this indicator suggests that during periods of extremely low volatility, it’s a prime time to enter the market since a shift in volatility is likely. These periods are marked by red lines in the indicator's sub-window and red candles on your chart. For determining the direction of your trade, consider using additional trend indicators.
About This Version:
While a previous version of this indicator (a standard sub-window version) was published here, this version operates differently. It avoids certain operations (like calculating long-period simple moving averages and standard deviations on modified data) that can be quite slow if coded purely in MQL. Instead, this indicator is broken down into functional parts that utilize built-in indicators whenever possible to ensure efficiency.
Attached to this post are all the necessary .mq5 files. However, for ease of use, the corresponding .ex5 files will be provided in a separate post, so you don’t have to worry about the multi-file compilation process.
Each attached indicator can function independently, but the two final indicators to focus on are the "on-chart" and the "2" indicators. The base indicators, as their name suggests, facilitate the essential calculations. Here’s what the "on-chart" version looks like (it automatically loads the "2" version for display on the same chart):

And here’s the "2" version by itself:
The on-chart version allows you to pinpoint which bars are potential candidates for a change in trend or market conditions (as illustrated in the "big picture" example below).

Note: Please do not alter the settings of the lower sub-window indicator if you are using the on-chart indicator. Adjust all settings from the indicator attached to the chart; changes will automatically reflect in the sub-window indicator as well.


Comments 0