Hey fellow traders! Today, we're diving into the fascinating world of Stoller Average Range Channels, or STARC. Developed back in the early 1980s by Manning Stoller, these bands are a unique tool designed to help you navigate market volatility.
So, what exactly are STARC bands? Well, they’re calculated using the average true range (ATR), which means they expand and contract based on the market's fluctuations. Here’s how you can easily calculate the bands:
- Upper Band: SMA(6) + 2 * ATR(15)
- Lower Band: SMA(6) - 2 * ATR(15)
Now, the function of STARC bands is a bit different compared to other band indicators. Here’s the deal:
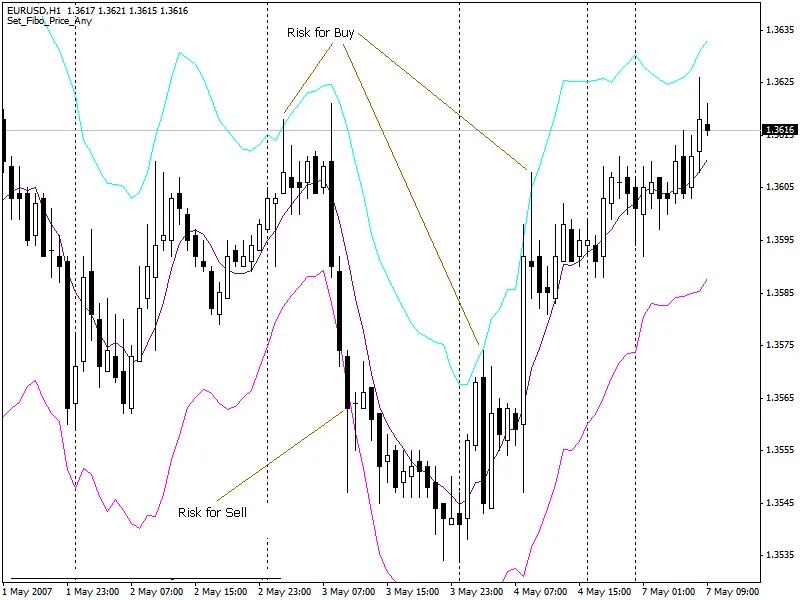
If the price action hits the upper band, it signals a high risk to buy and a lower risk to sell. Conversely, when the price action drops to the lower band, it indicates a high risk to sell and a lower risk to buy. This insight can be a game changer in your trading strategy!
By keeping an eye on these bands, you can make more informed decisions and potentially increase your trading success. So, give STARC a shot, and let me know how it works for you!


Comments 0