What is the Dynamic Momentum Index?
The Dynamic Momentum Index (DMI) is a handy tool in technical analysis, designed to help traders spot overbought and oversold conditions in various assets. Think of it as a cousin to the Relative Strength Index (RSI). The key difference? While the RSI typically sticks to a fixed number of time periods—usually around 14—the DMI adjusts its time periods based on market volatility.
How Does the Dynamic Momentum Index Work?
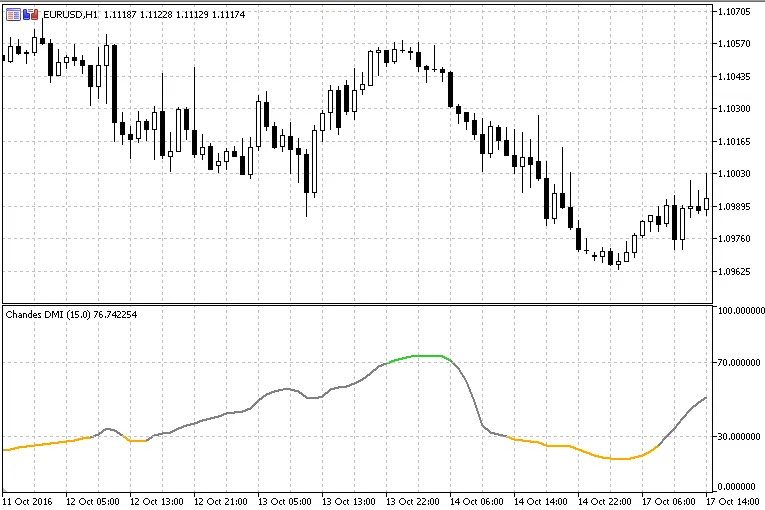
Much like the RSI, the DMI provides readings that help traders gauge market sentiment. Generally, readings below 30 indicate that an asset is oversold, while those above 70 suggest it's overbought. What sets the DMI apart is its ability to decrease the number of time periods used as volatility rises. This feature makes the DMI more sensitive to price fluctuations compared to the classic RSI.
Another noteworthy aspect of the DMI is that it incorporates an RSX for its calculations rather than the original RSI. This adjustment makes the indicator smoother and easier to interpret. The traditional Chande's DMI can be a bit choppy, often leading to false signals. However, by using the RSX, you won’t experience any lag, which is a win for traders. This approach aligns with the “1% improvement” philosophy—it's a subtle tweak that enhances performance without sacrificing accuracy.
Related Posts
- Unlocking MetaCOT 2: Your Ultimate CFTC Indicator Toolkit for MT4
- Unlocking the Power of Master Tools for MetaTrader 4
- Visualize Current Trends Across All Time Frames with This MetaTrader 4 Indicator
- Mastering the MACD Candle Indicator for MetaTrader 4
- Unlock Trading Insights with Volume Profile + Range v6.0 for MetaTrader 5