What is the Histogram Indicator?
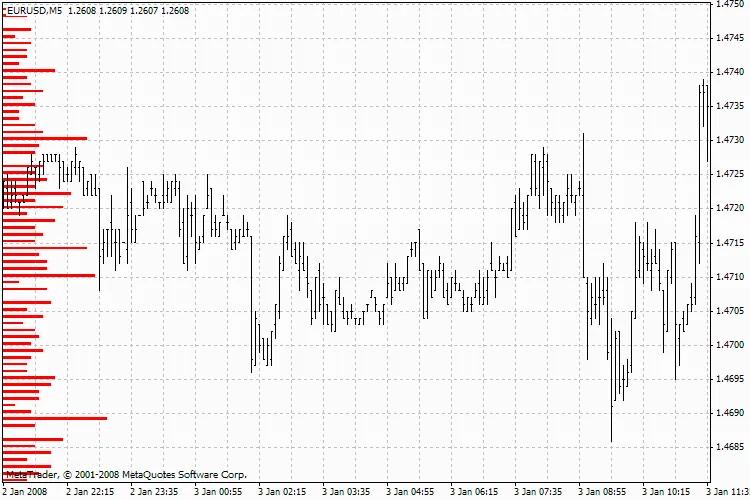
The Histogram Indicator is a powerful tool that helps traders visualize price action by calculating the number of local highs and lows for a given asset. It looks at every price point throughout the asset's history, and the results are displayed as a histogram on the left side of your chart.
How It Works
This indicator identifies local maximums (highs) and minimums (lows) of the price. To minimize market noise and improve reliability, it only confirms these levels after they align with the corresponding highs and lows of a supporting moving average.
Customization Options
- The Histogram Indicator is versatile and works across all timeframes.
- You can easily adjust the color and size of the histogram to suit your preferences.
Making the most of this tool can enhance your trading strategy, giving you clearer insights into price movements. So, whether you’re a seasoned trader or just starting, experimenting with the Histogram Indicator can certainly pay off!


Comments 0