The MACD (Moving Average Convergence Divergence) indicator is a popular tool among traders, especially for those using MetaTrader 4. It helps in identifying potential buy and sell signals, making it an essential part of many trading strategies.
One of the great things about the MACD is its versatility. Whether you're a day trader or a long-term investor, this indicator can help you make informed decisions. Let’s dive into how it works and how you can incorporate it into your trading routine.
What is the MACD Indicator?
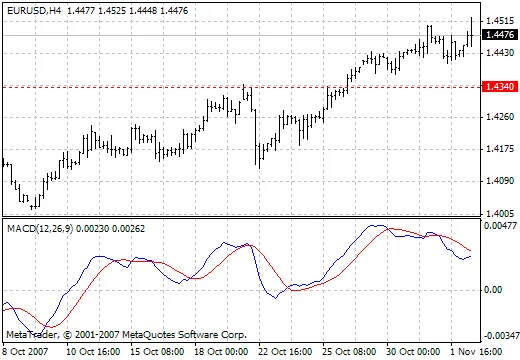
The MACD is a trend-following momentum indicator that shows the relationship between two moving averages of a security’s price. It consists of three main components:
- MACD Line: This is the difference between the 12-day and 26-day exponential moving averages (EMAs).
- Signal Line: This is a 9-day EMA of the MACD line, used to generate buy or sell signals.
- Histogram: This represents the difference between the MACD line and the Signal line, providing a visual representation of momentum.
How to Use the MACD in Your Trading
To effectively use the MACD, keep an eye out for the following signals:
- Crossovers: When the MACD line crosses above the Signal line, it indicates a potential buy signal. Conversely, a crossover below suggests a sell signal.
- Histogram Changes: A growing histogram indicates increasing momentum in the direction of the MACD line, while a shrinking histogram may signal a reversal.
Remember, while the MACD can be a powerful tool, it's always best to use it in conjunction with other indicators and analysis methods. Happy trading!


Comments 0