Hey there, fellow traders! Today, I want to dive into the Multy_MA indicator, which helps you visualize the difference between two moving averages (MAs) in a separate window.
You can customize both minor and major moving averages according to your trading strategy. This indicator is designed for group moving, making it easier to track market trends.
Now, here's a little heads-up: there’s a bit of a glitch in the code. The indicator may not draw everything immediately. To get it up and running smoothly, you might need to reload the timeframe. Make sure your history is uploaded. If the display seems off, try switching the timeframe again; this should refresh the data and redraw the picture correctly.
As a handy tip, if you hover your mouse over any line, the name of the currency will pop up at the bottom—super useful for quick references!
Input Parameters:
externint MA_Period =5;externint MA_Basis =233;externint MA_Shift =0;externint MA_Method =1;//----externstring symbol_1 ="EURUSD";externstring symbol_2 ="GBPUSD";externstring symbol_3 ="USDCHF";externstring symbol_4 ="USDJPY";externstring symbol_5 ="AUDUSD";externstring symbol_6 ="USDCAD";externstring symbol_7 ="medium";//----//----externbool revers=false;
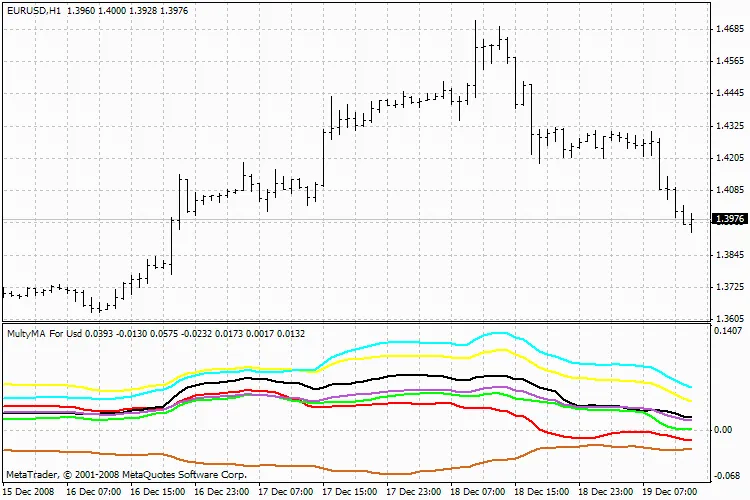
Multy_MA
So there you have it! The Multy_MA indicator is a handy tool for any trader looking to analyze moving averages effectively. Give it a try and see how it fits into your trading approach!


Comments 0